sjp.xtab
Plot contingency tables
sjp.stackfrq
Plot stacked proportional bars
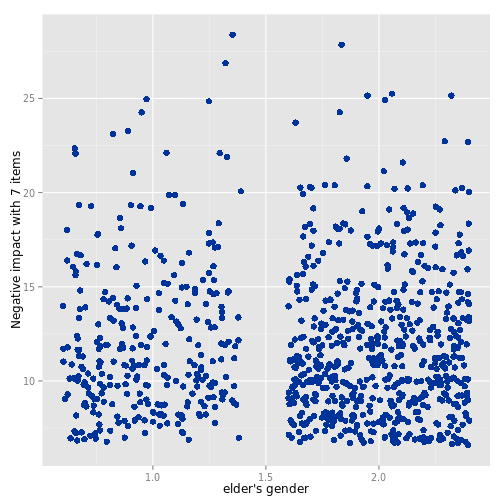
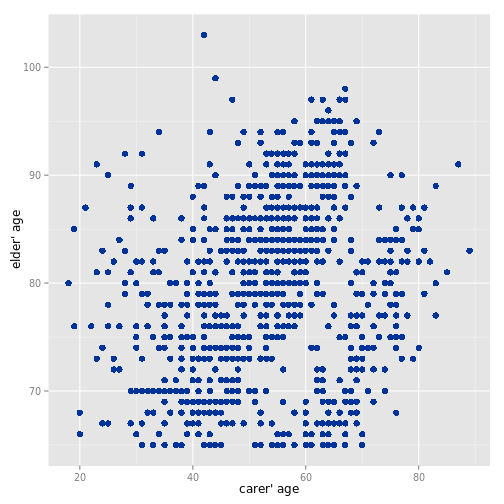
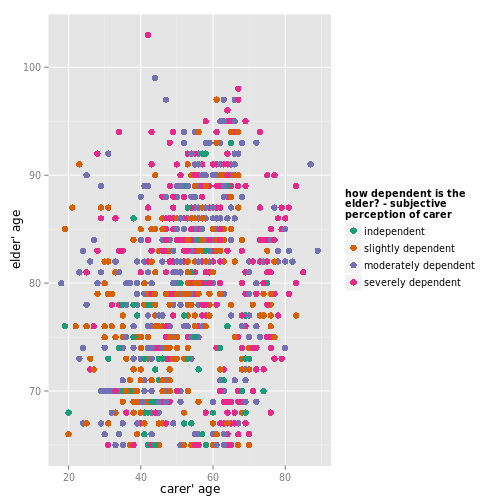
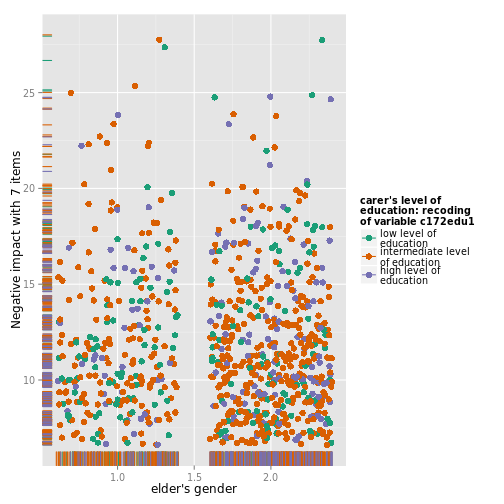
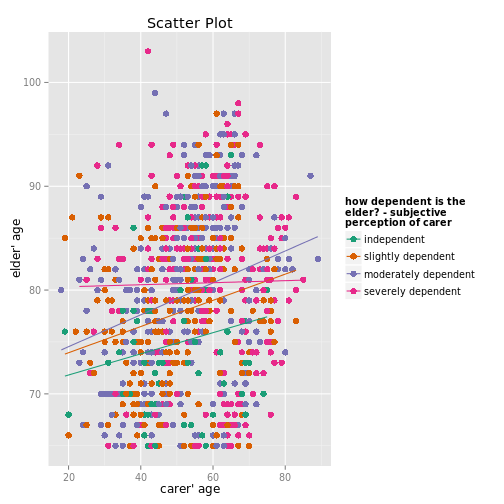
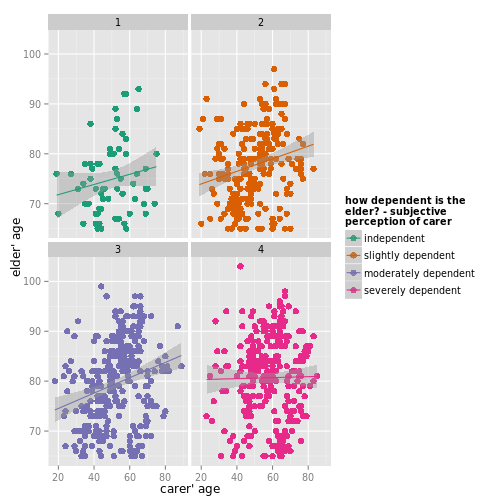
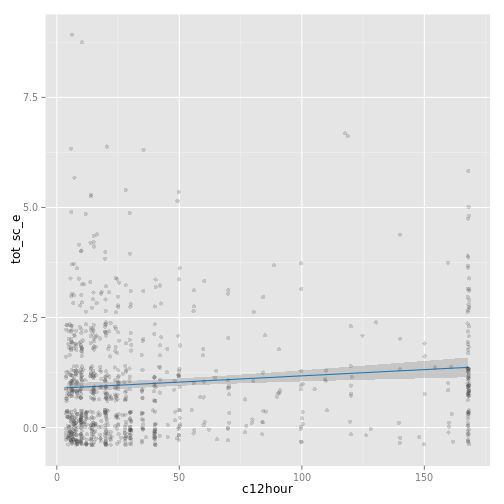
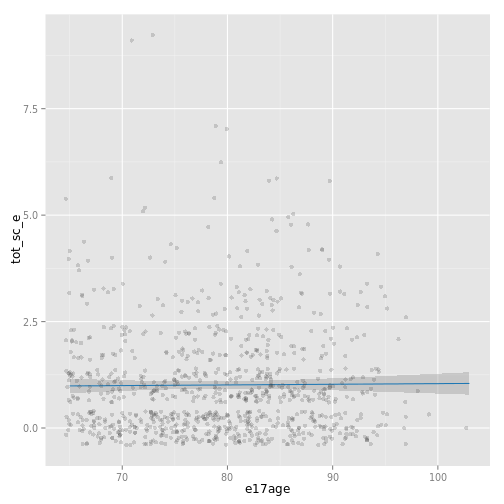
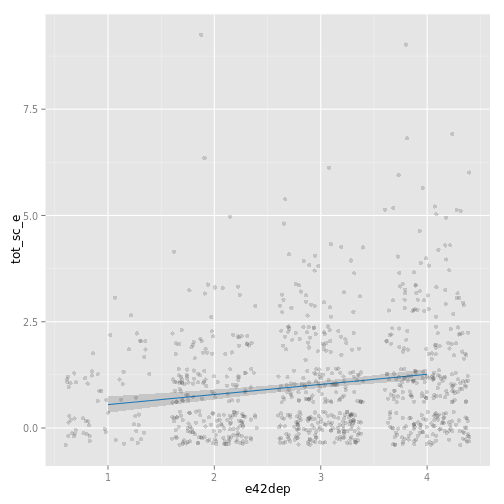
sjp.scatter
Plot (grouped) scatter plots
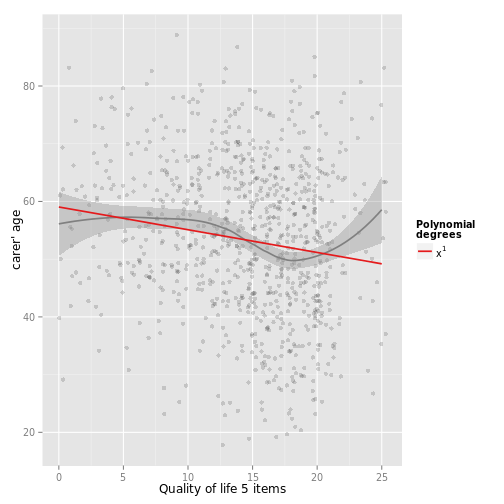
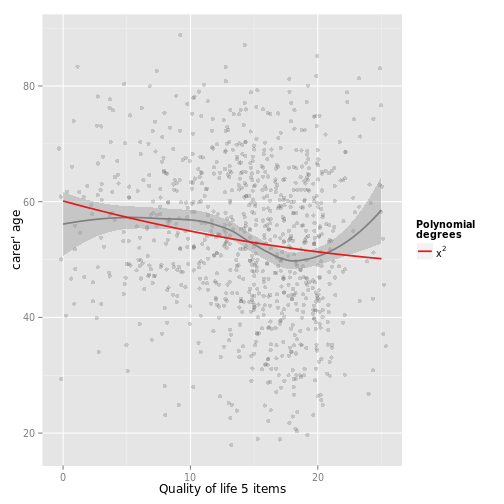
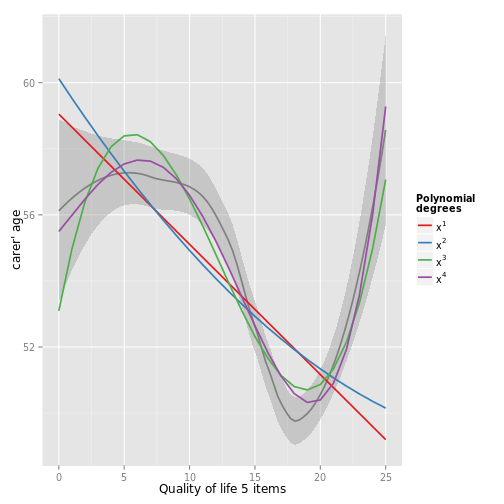
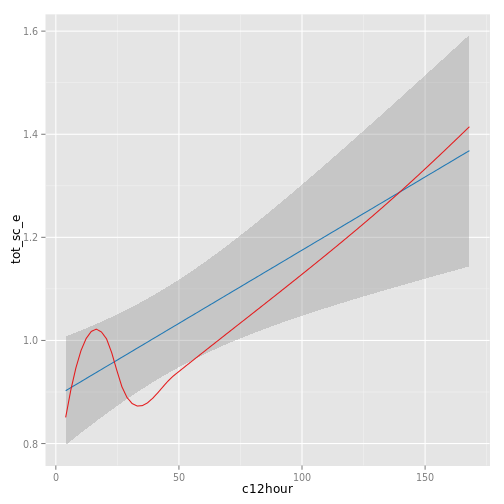
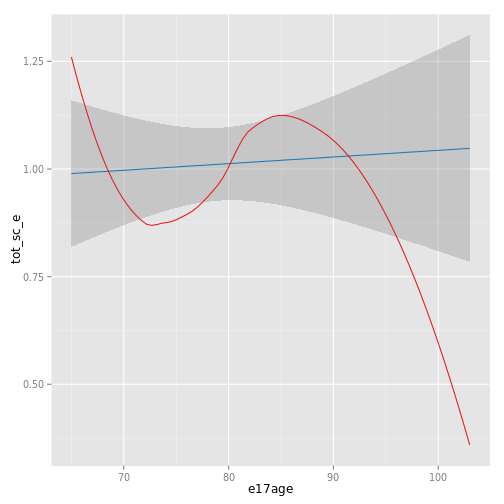
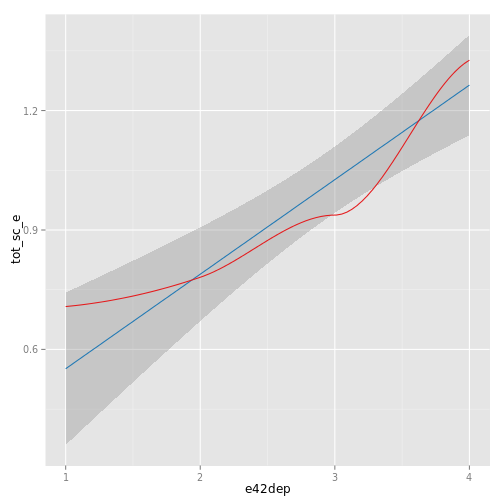
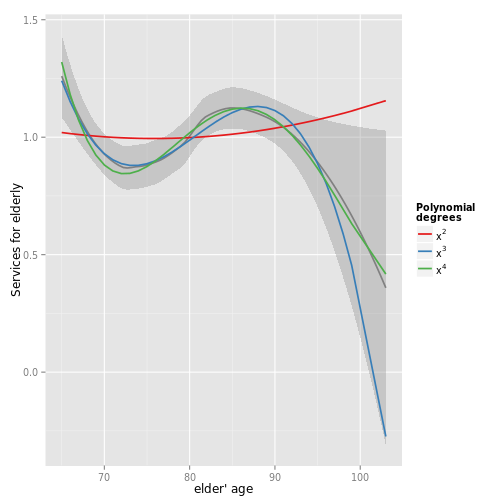
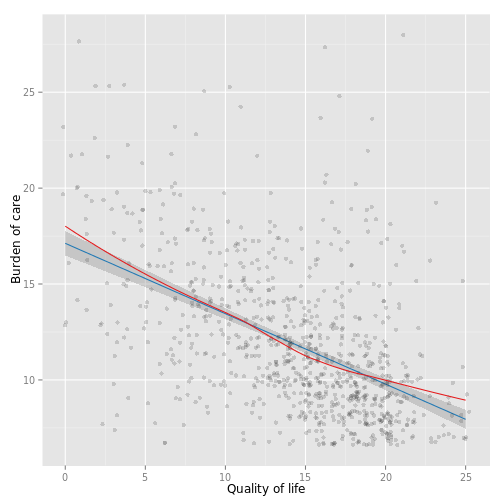
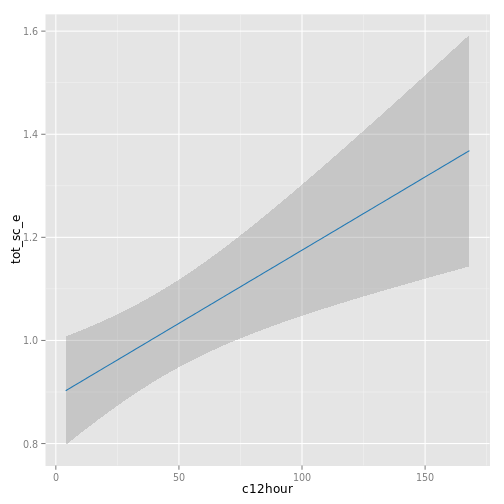
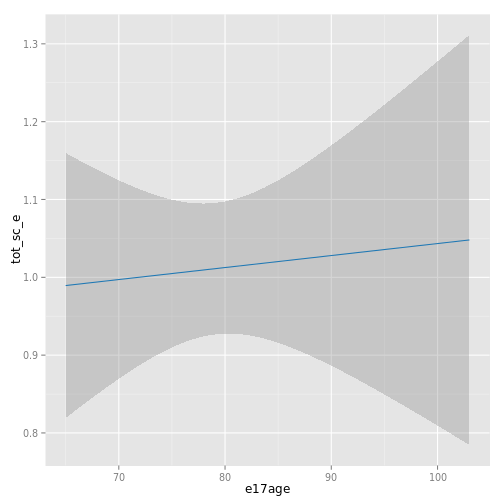
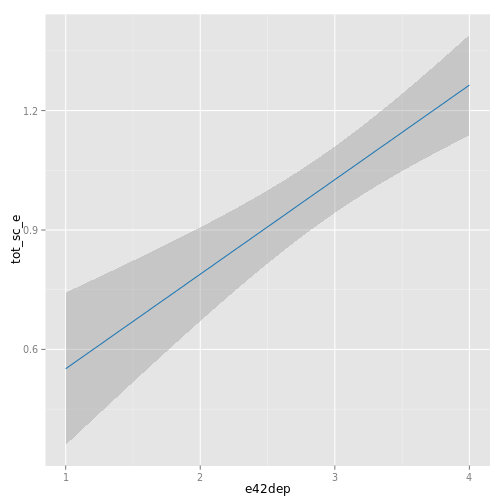
sjp.poly
Plot polynomials for (generalized) linear regression
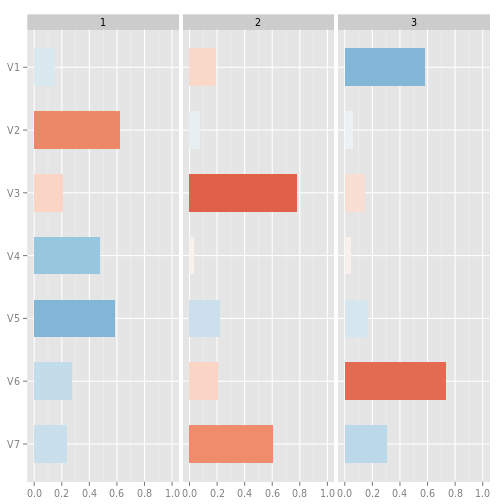
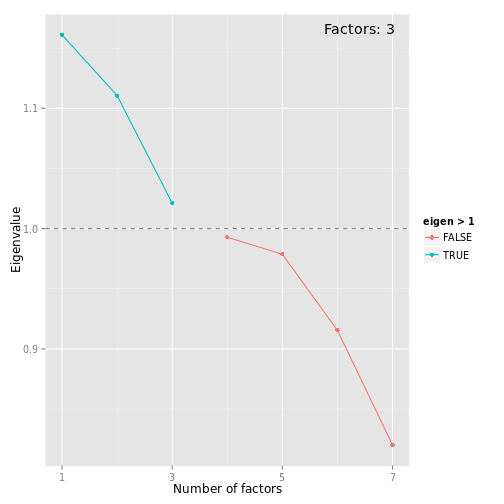
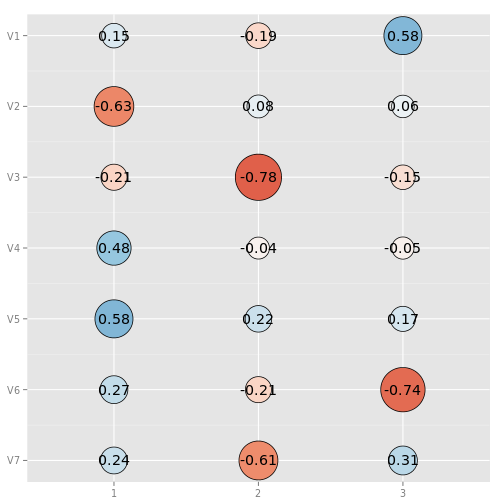
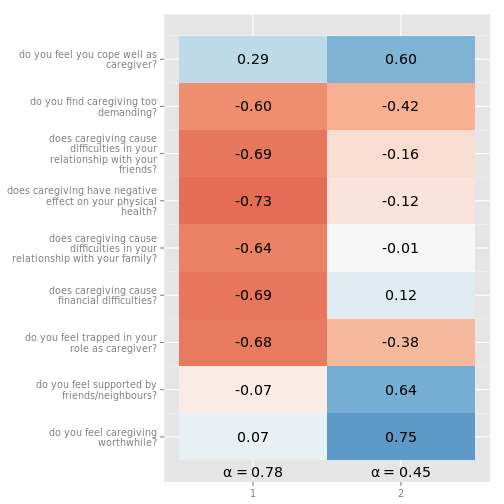
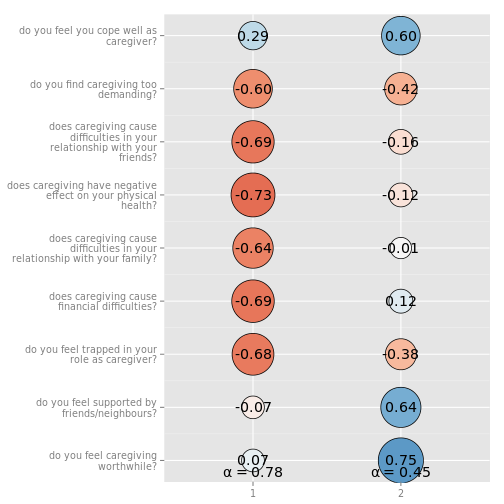
sjp.pca
Plot PCA results
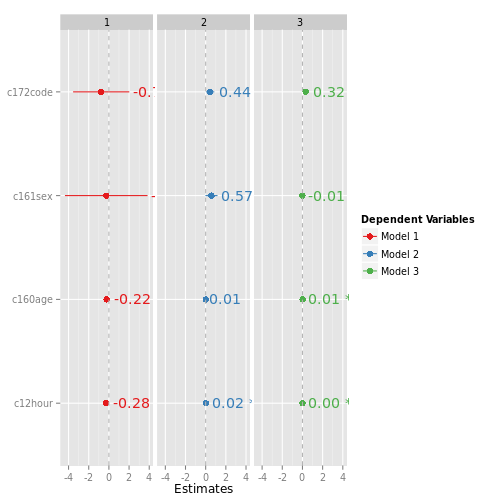
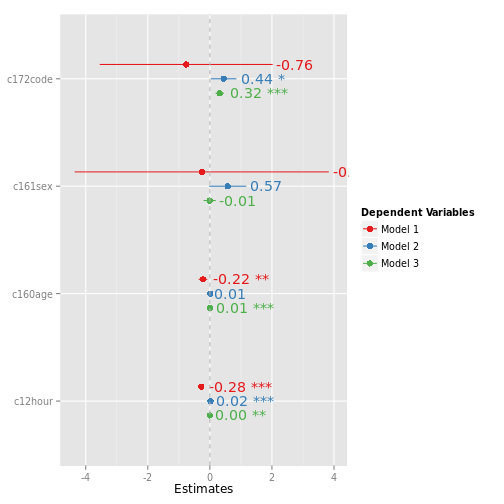
sjp.lmm
Plot coefficients of multiple fitted lm's
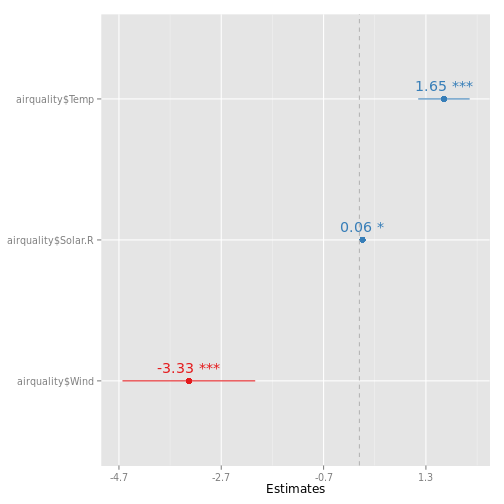

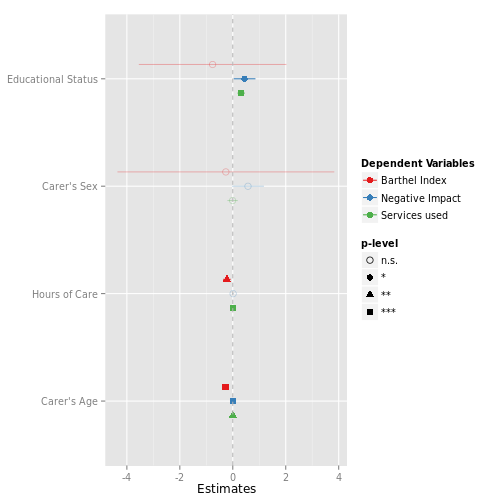
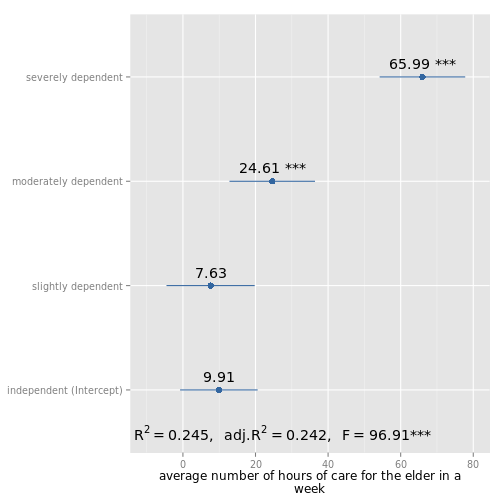
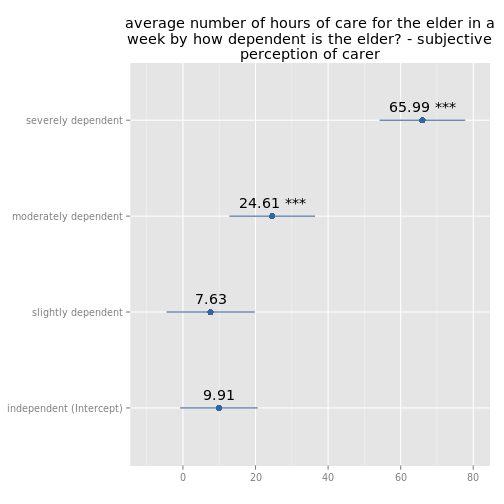
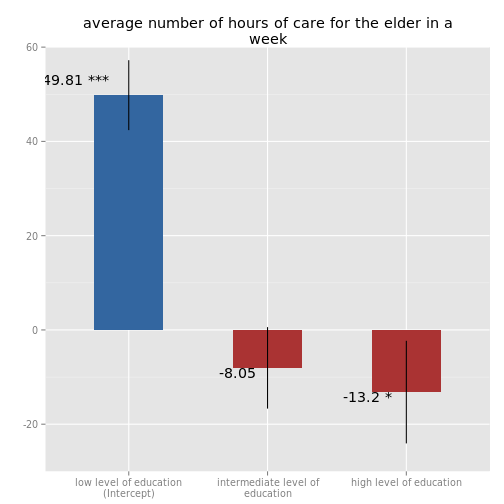
sjp.lm
Plot estimates or predicted values of linear models
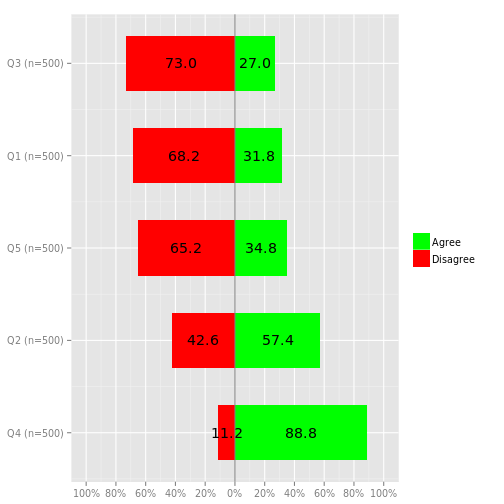
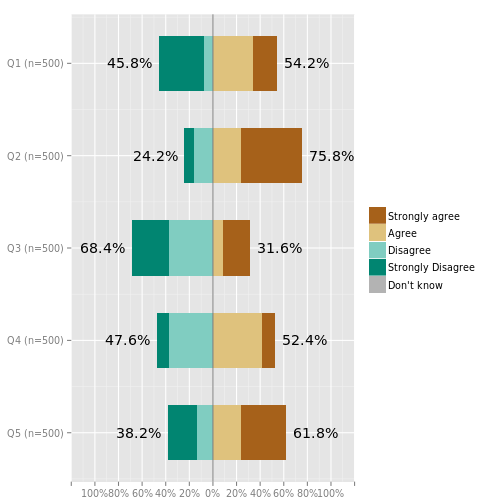
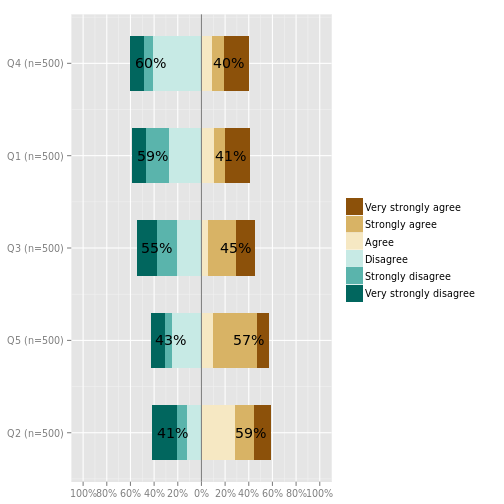
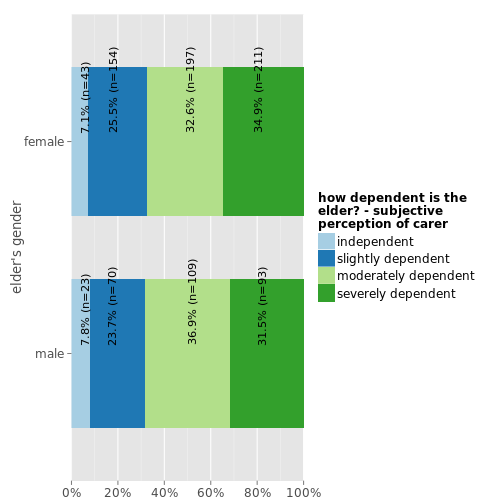
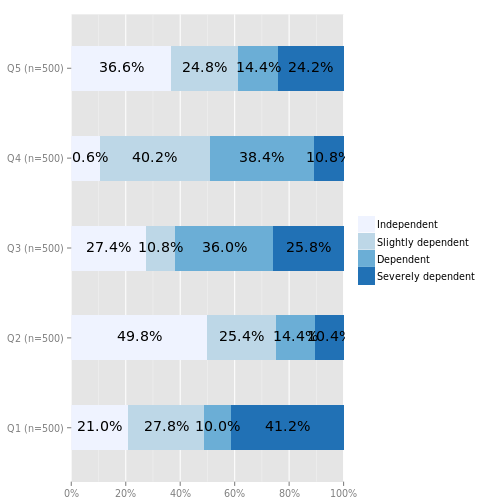
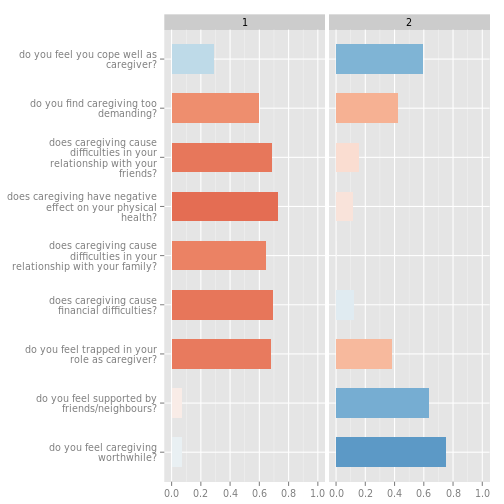
sjp.likert
Plot likert scales as centered stacked bars
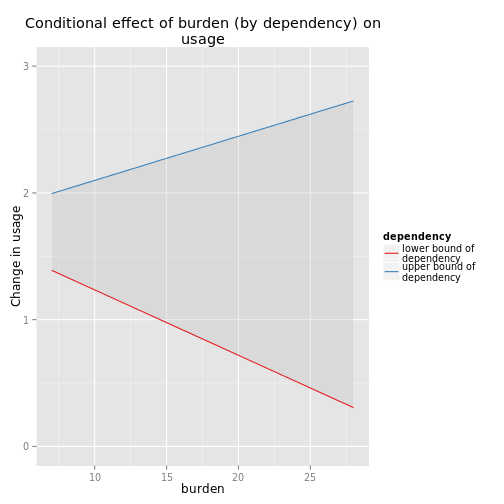
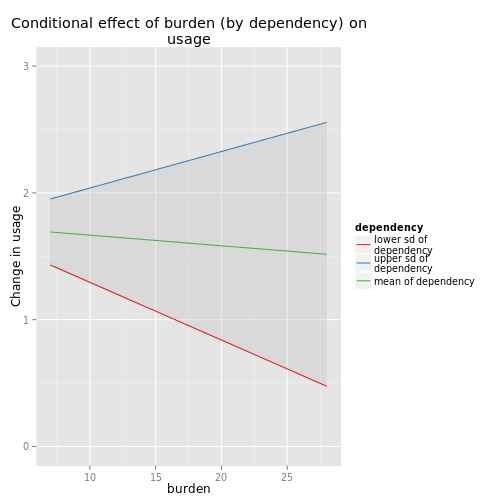
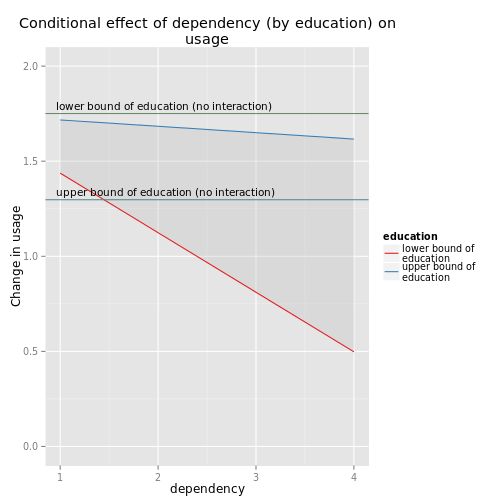
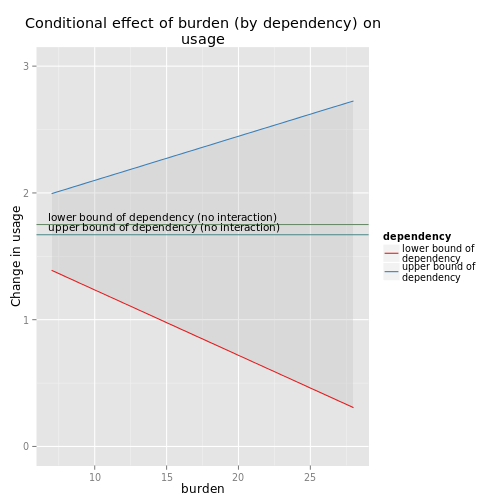
sjp.int
Plot interaction effects of (generalized) linear (mixed) models
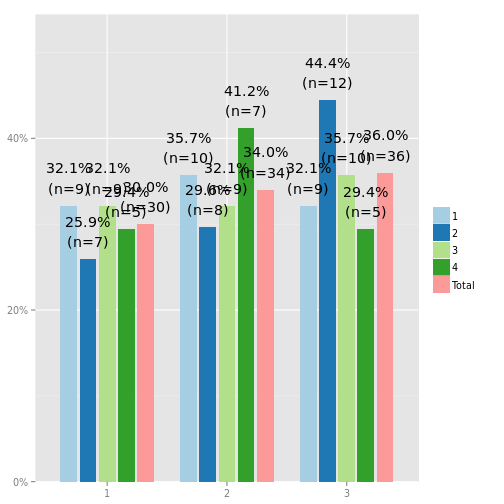
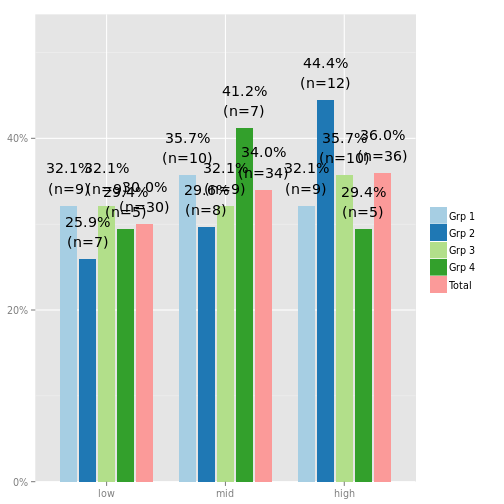
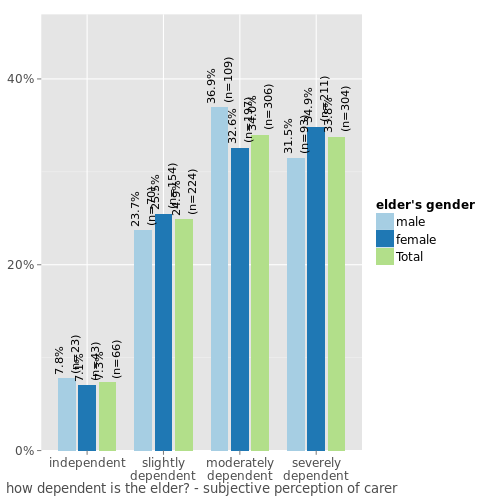
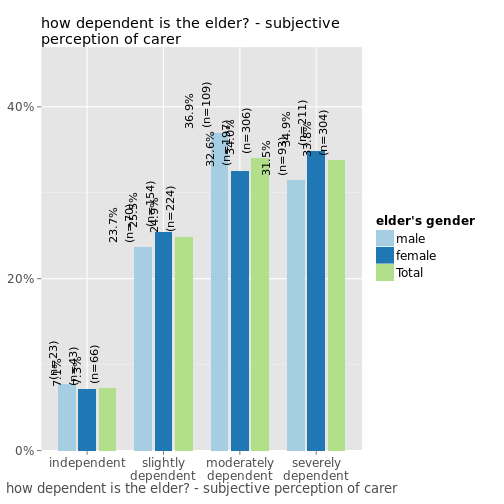
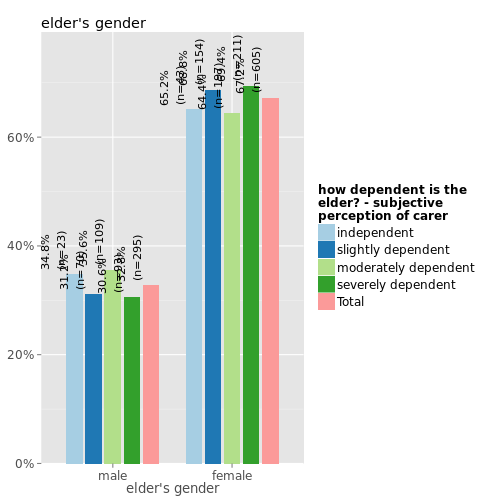
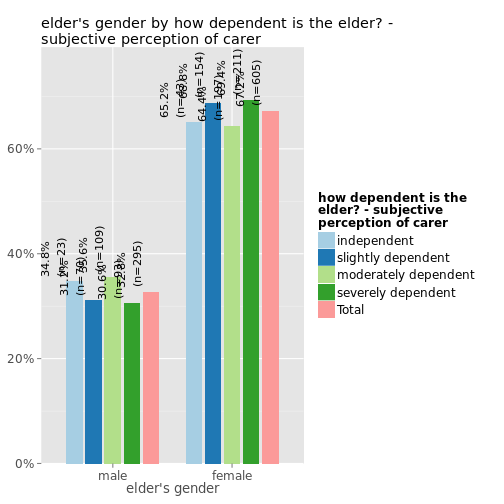
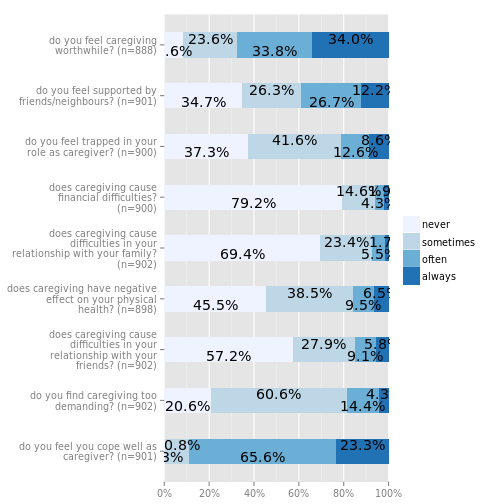
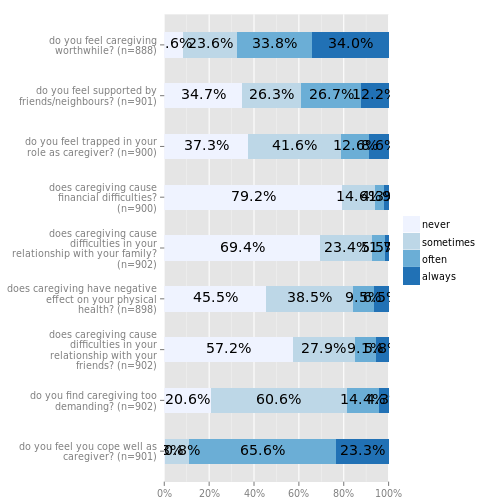
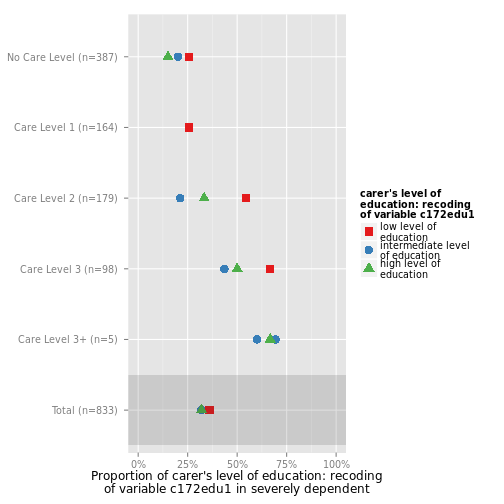
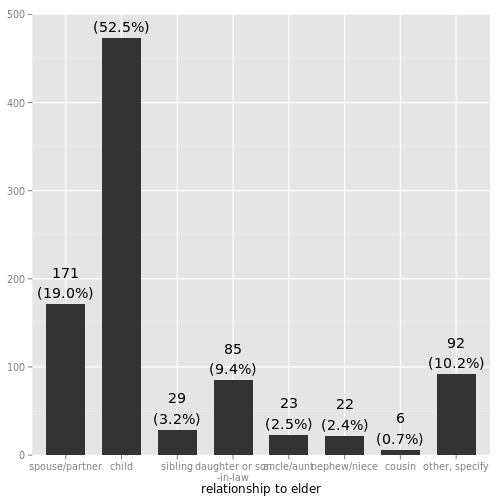
sjp.grpfrq
Plot grouped or stacked frequencies
sjp.gpt
Plot grouped proportional tables
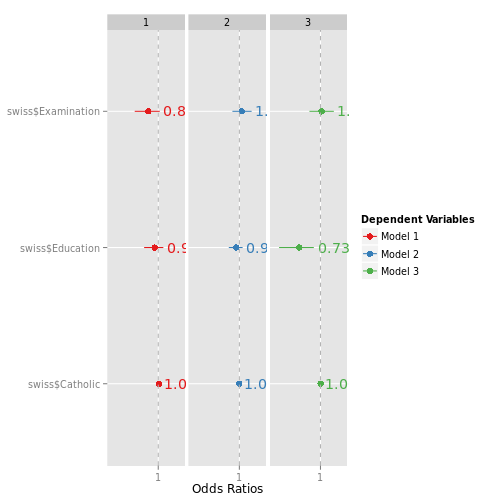
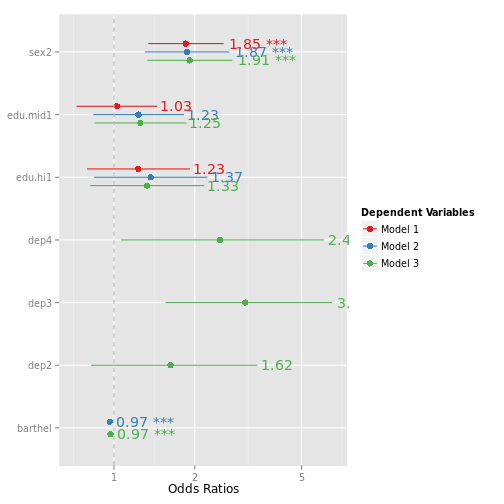
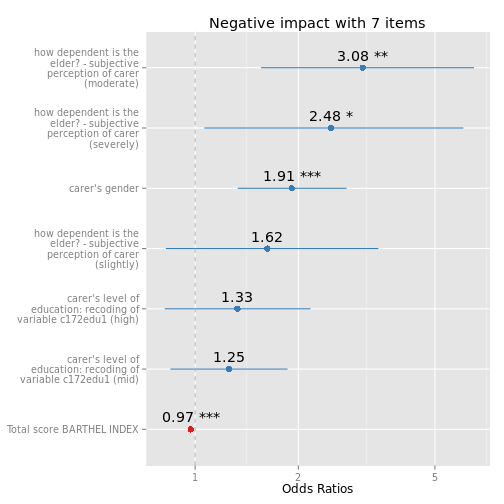
sjp.glmm
Plot odds ratios (forest plots) of multiple fitted glm's
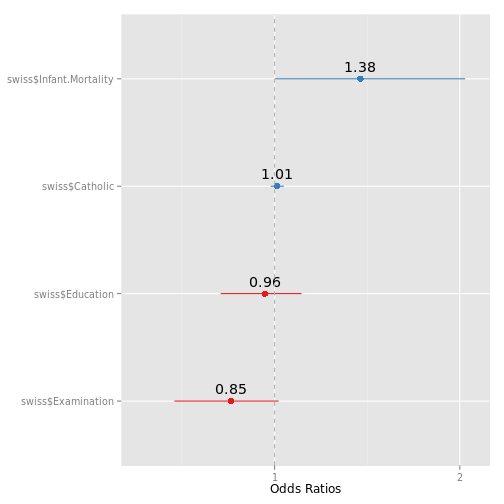
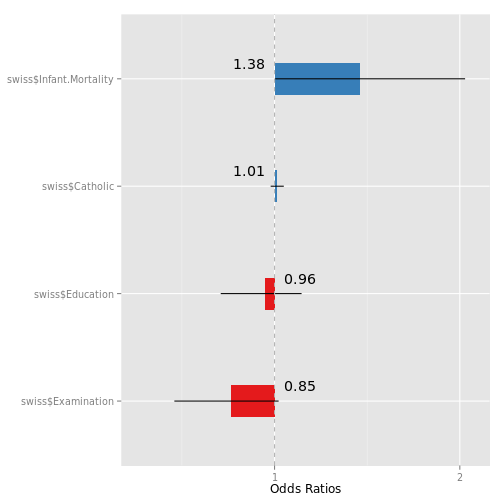
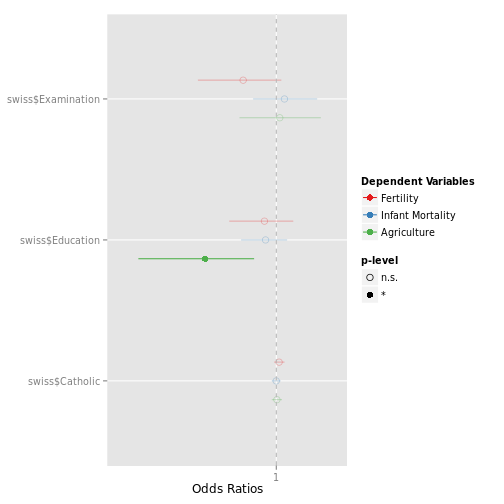
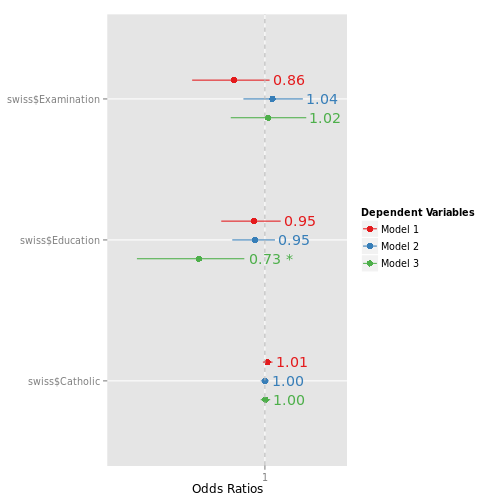
sjp.glm
Plot odds ratios or predicted probabilities of generalized linear models
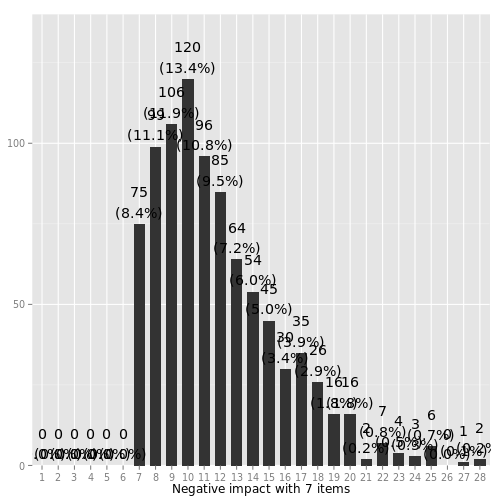
sjp.frq
Plot frequencies of (count) variables
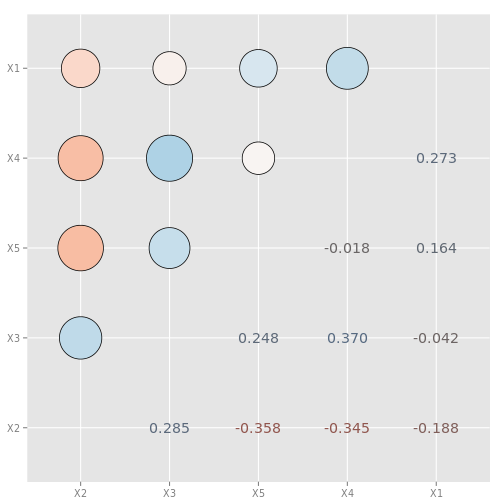
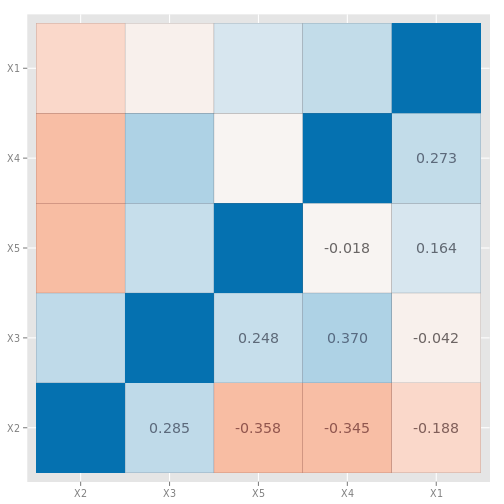
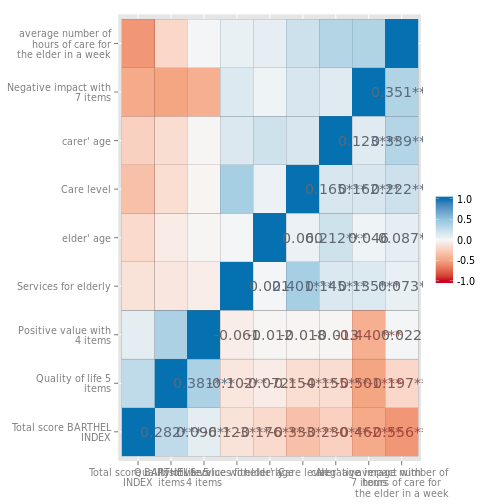
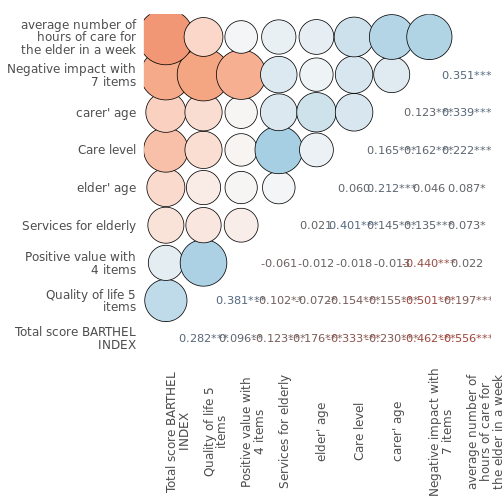
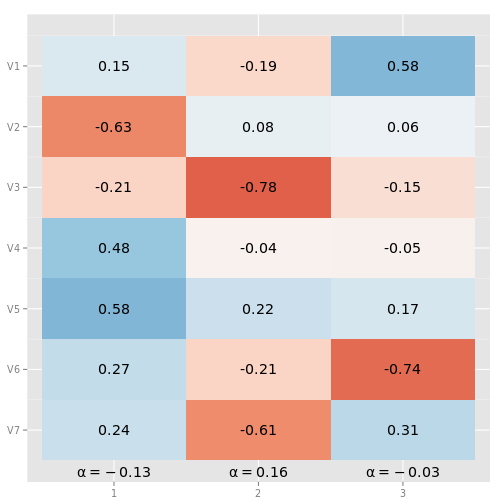
sjp.corr
Plot correlation matrix
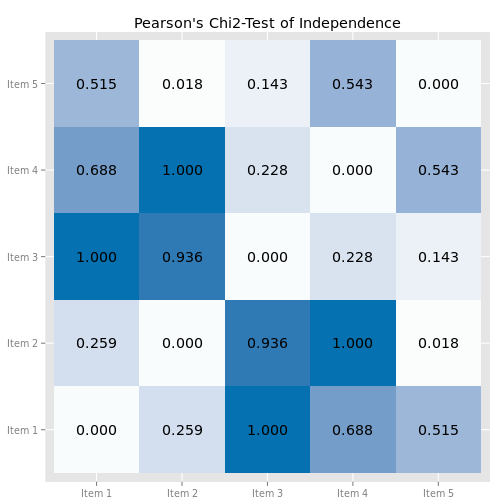
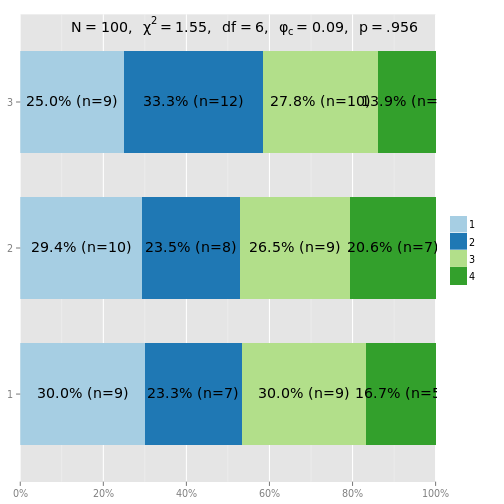
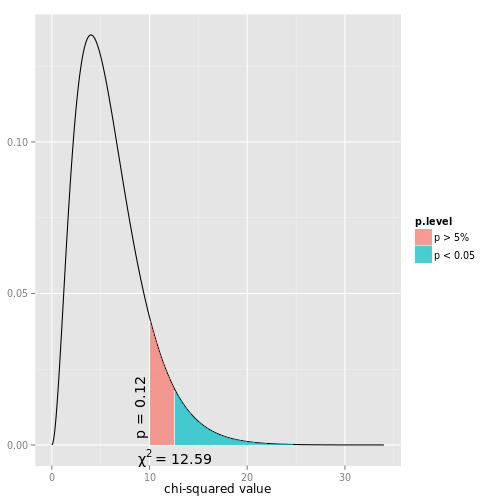
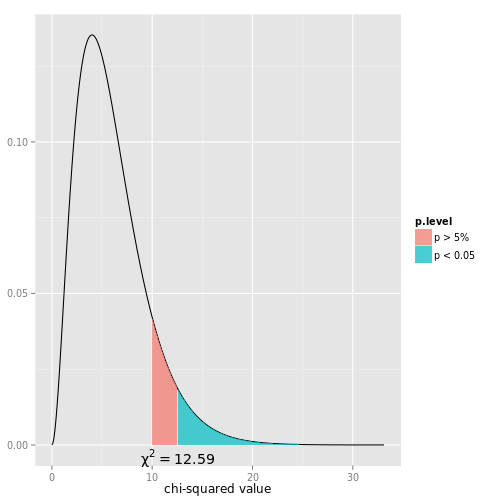
sjp.chi2
Plot Pearson's Chi2-Test of multiple contingency tables

sjp.aov1
Plot One-Way-Anova tables
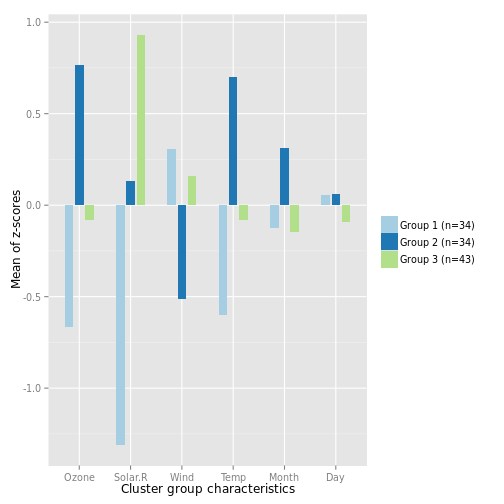

sjc.qclus
Compute quick cluster analysis
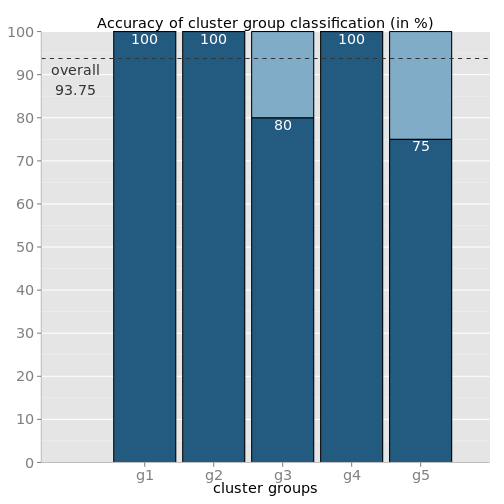
sjc.grpdisc
Compute a linear discriminant analysis on classified cluster groups
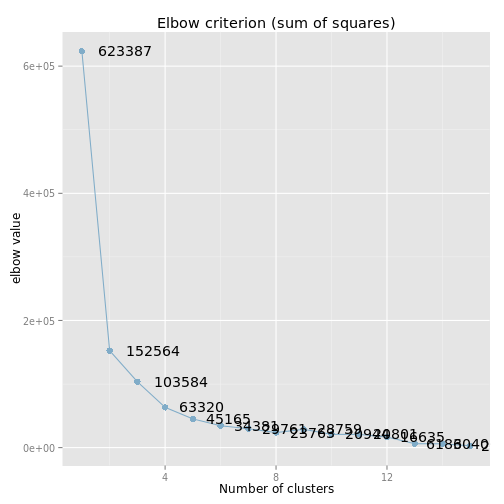
sjc.elbow
Compute elbow values of a k-means cluster analysis
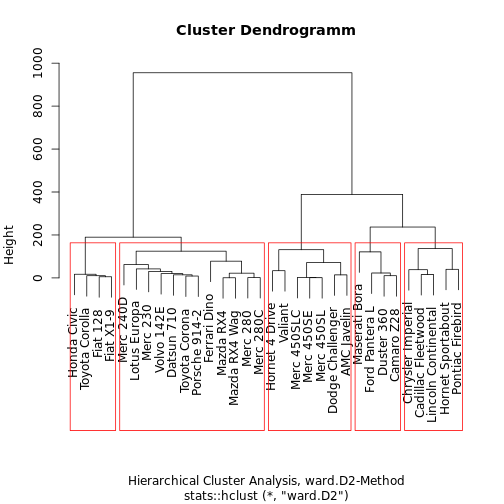
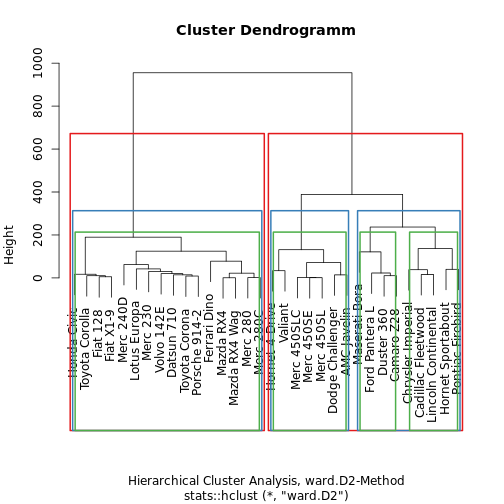
sjc.dend
Compute hierarchical cluster analysis and visualize group classification
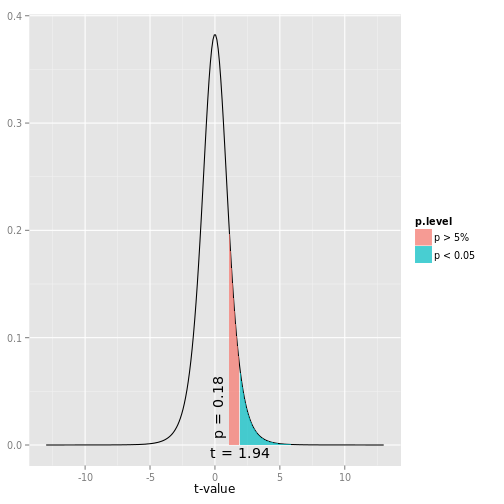
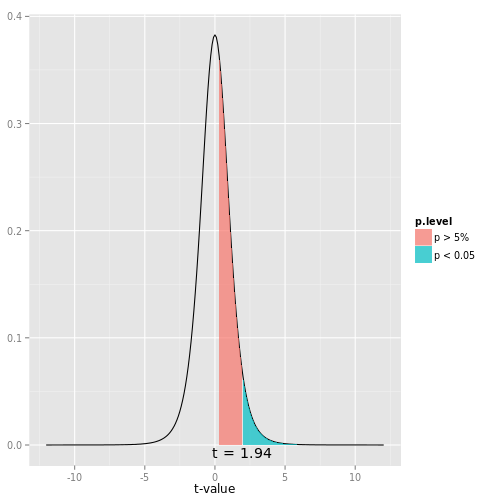
dist_t
Plot t-distributions
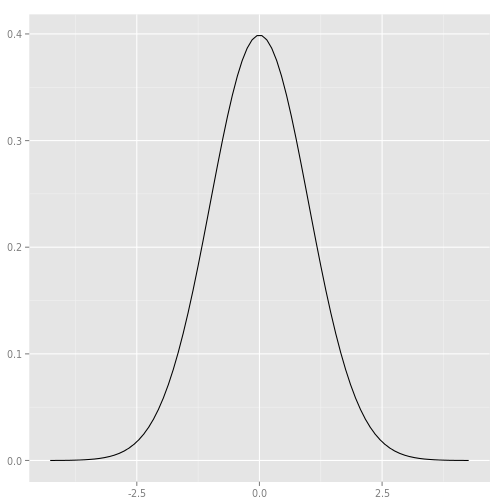
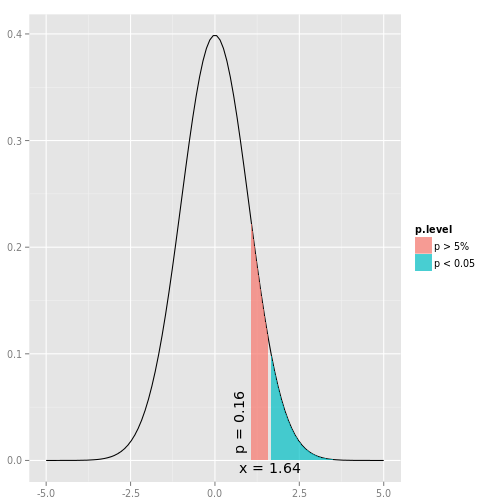
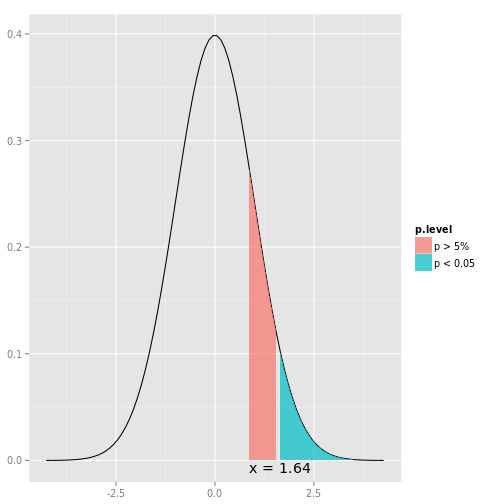
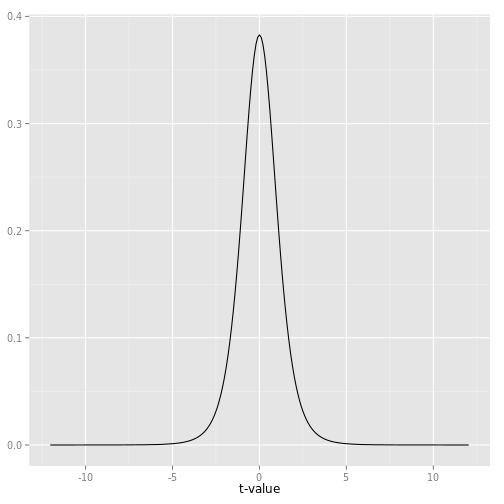
dist_norm
Plot normal distributions
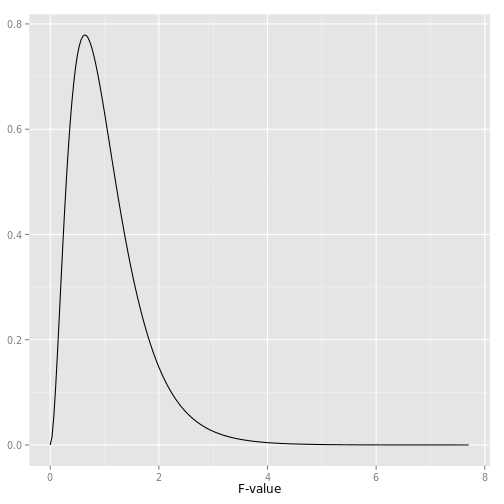
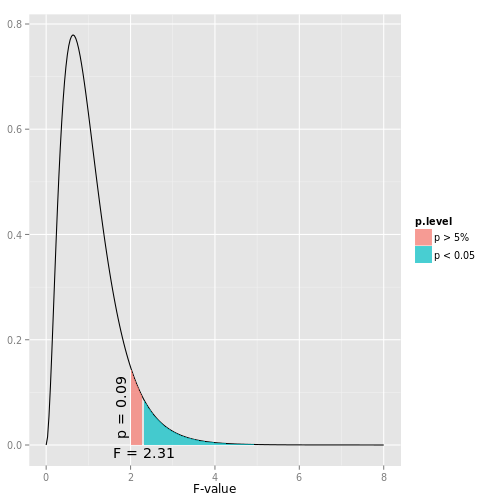
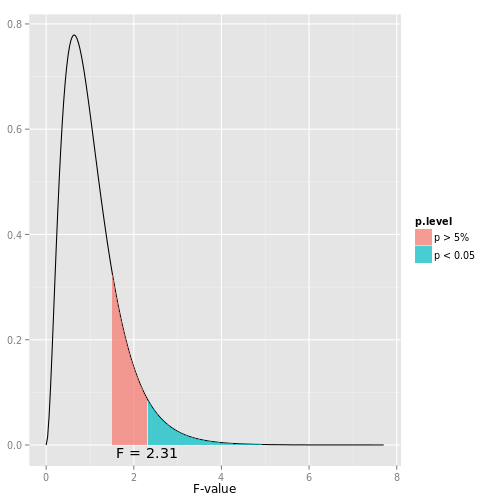
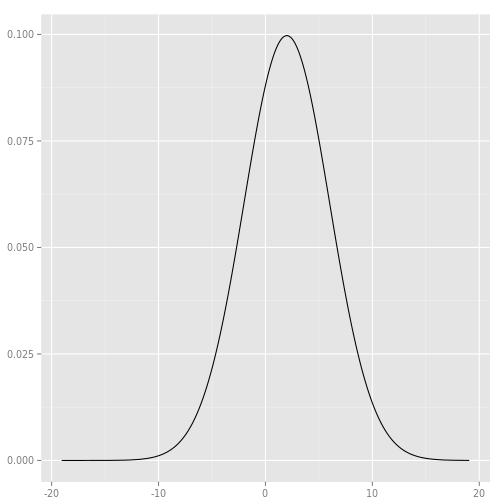
dist_f
Plot F distributions
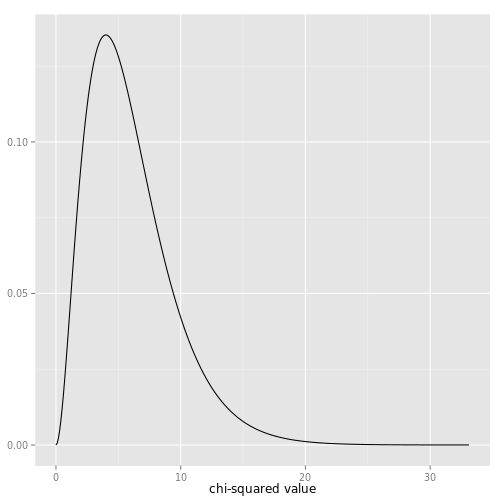
dist_chisq
Plot chi-squared distributions
adjust_plot_range
Adjust y range of ggplot-objects