# a simple normal distribution
dist_norm()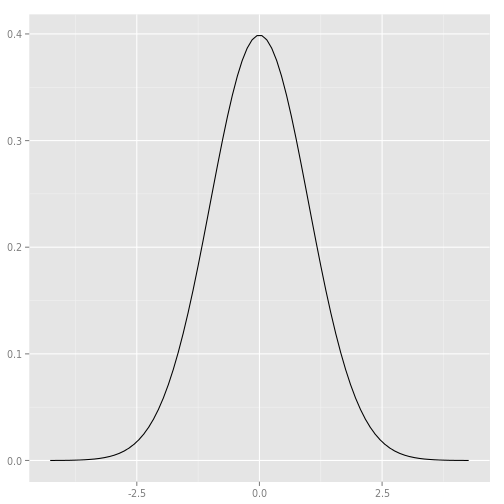
# a simple normal distribution with different mean and sd.
# note that curve looks similar to above plot, but axis range
# has changed.
dist_norm(mean = 2, sd = 4)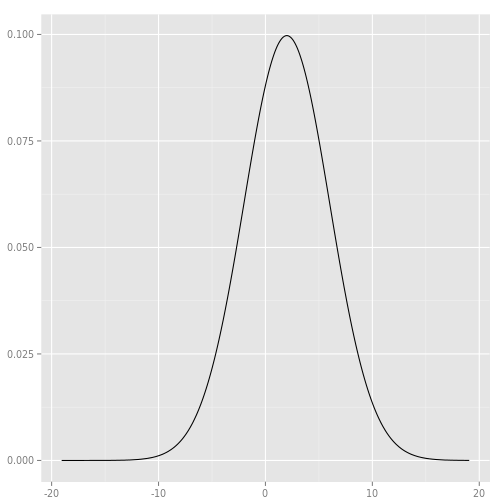
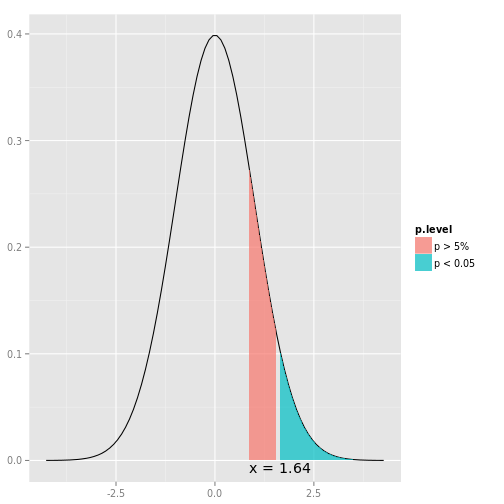
# a simple normal distribution
dist_norm(norm = 1)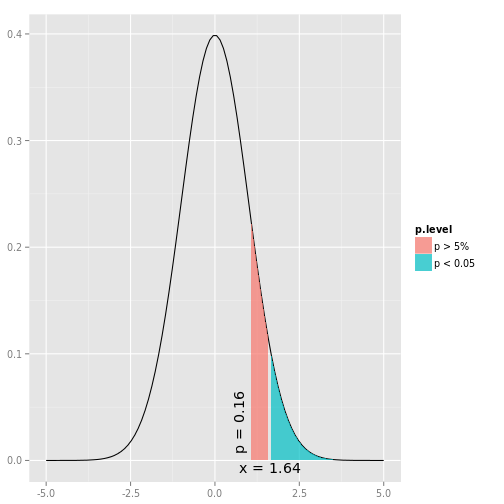
# a simple normal distribution
dist_norm(p = 0.2)