scatmat
scatmat - plot the lowertriangle plots and density plots of the scatter plot matrix.
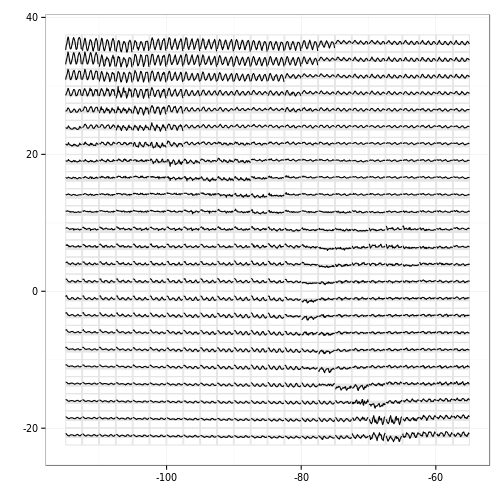
glyphs
Create the data needed to generate a glyph plot.
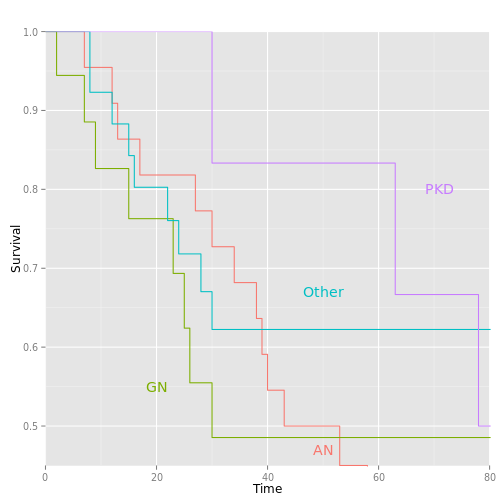
ggsurv
Plot survfit objects using ggplot2
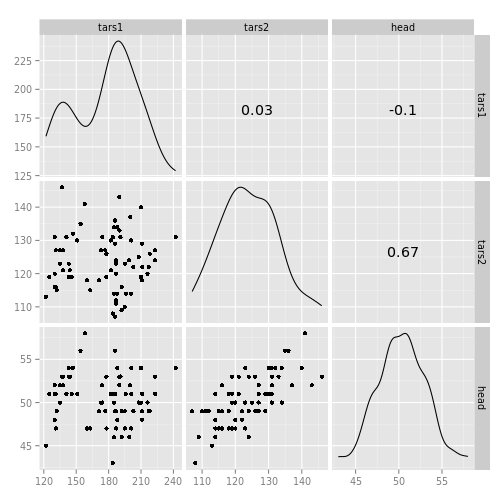
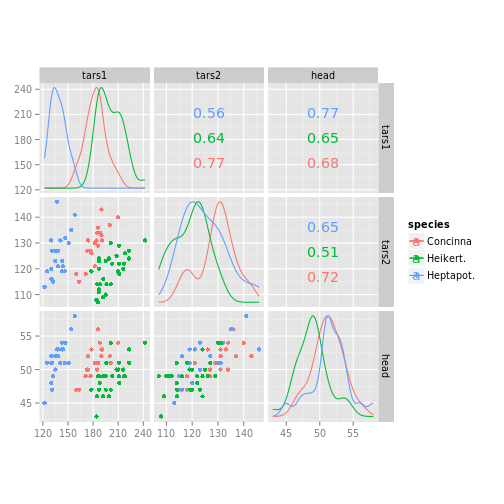
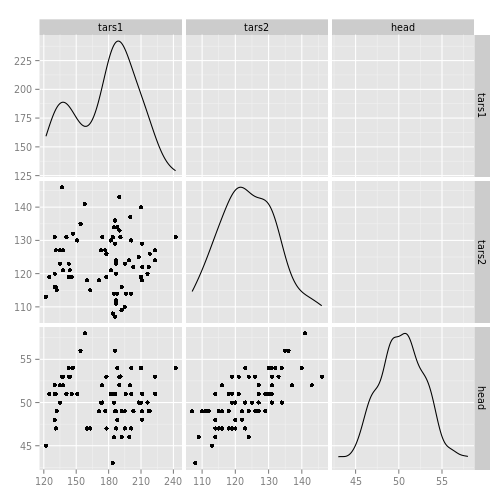
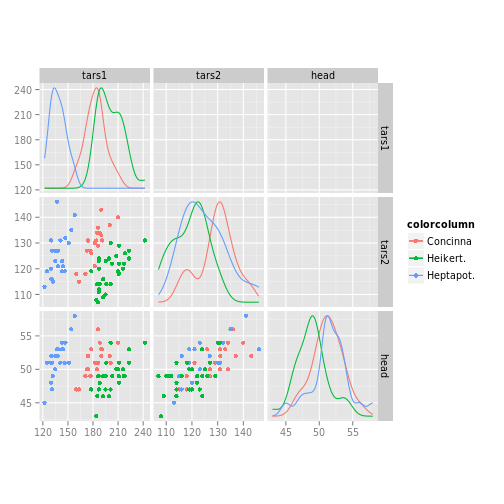
ggscatmat
ggscatmat - a traditional scatterplot matrix for purely quantitative variables

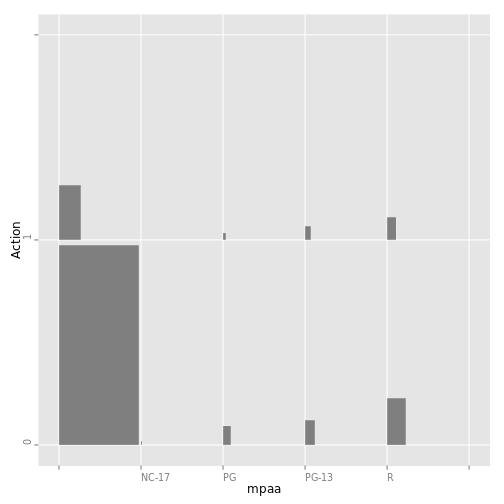
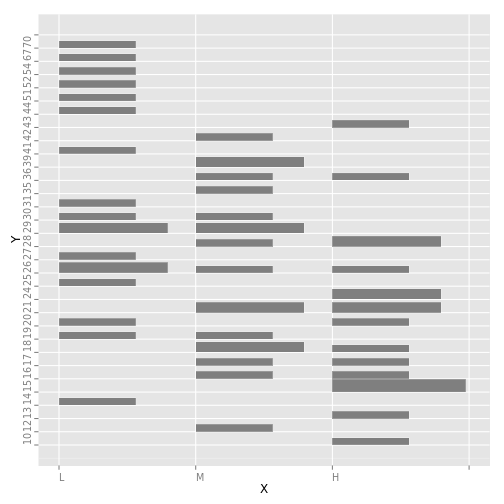
ggfluctuation2
Fluctuation plot
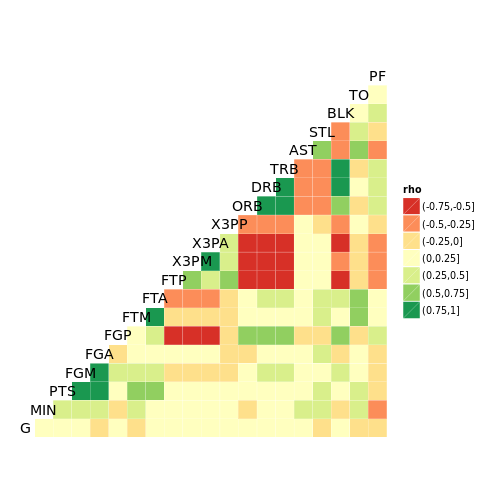
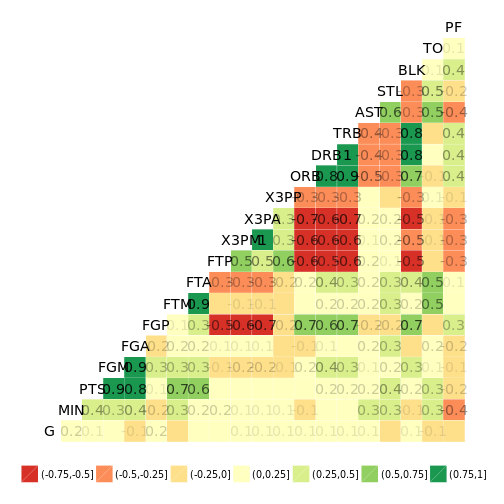
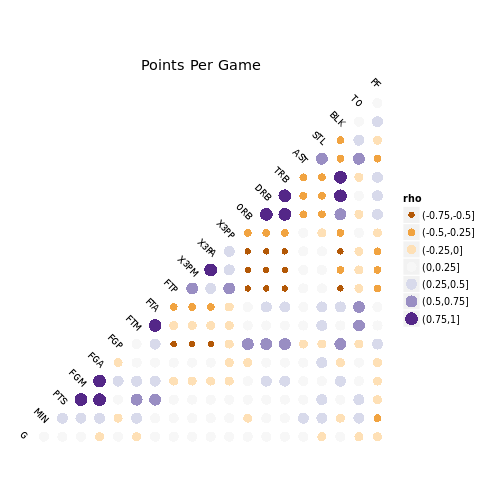
ggcorr
ggcorr - Plot a correlation matrix with ggplot2
ggally_text
GGplot Text

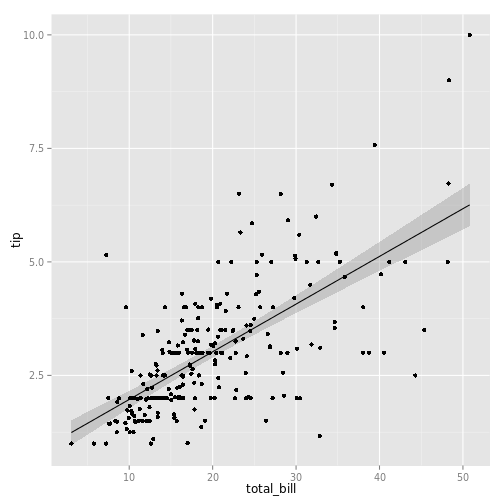
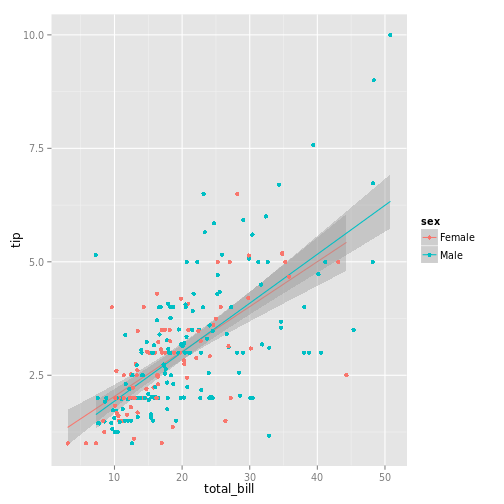
ggally_smooth
Plots the Scatter Plot with Smoothing
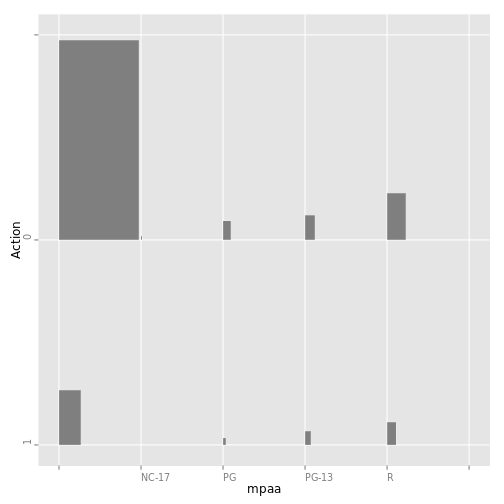
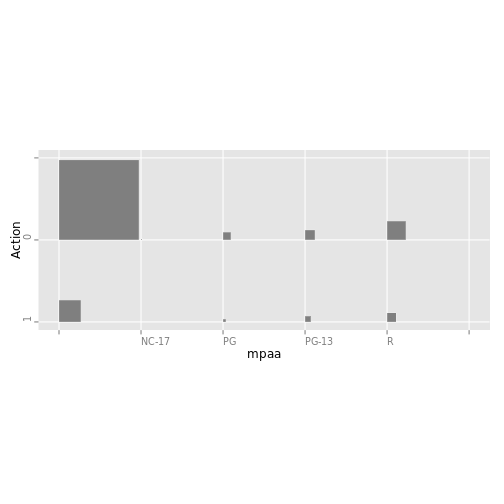
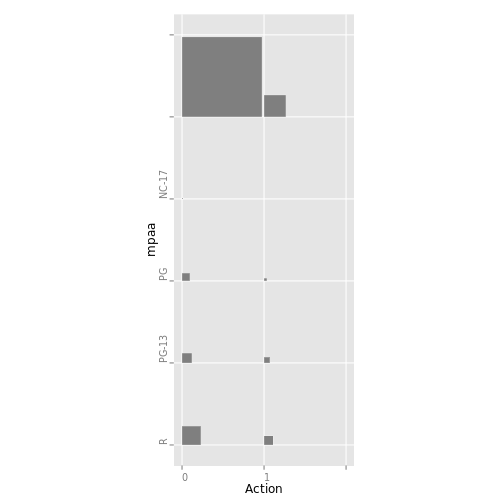
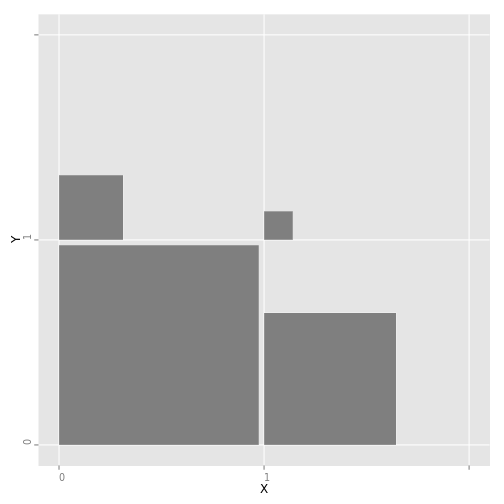
ggally_ratio
Plots a mosaic plots

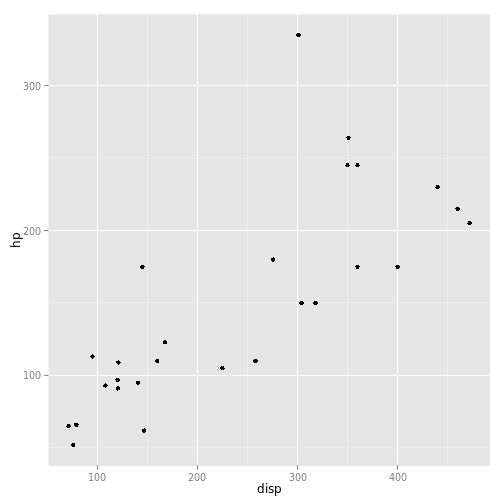
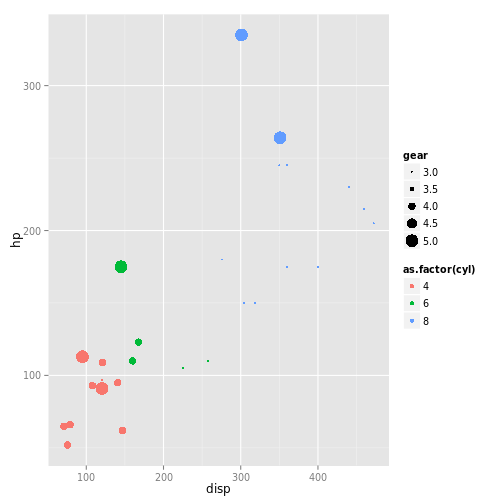
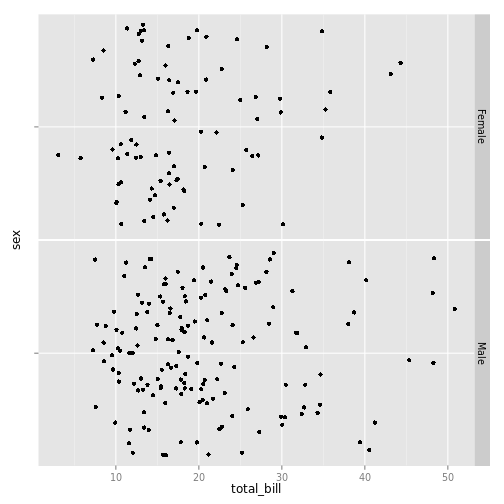
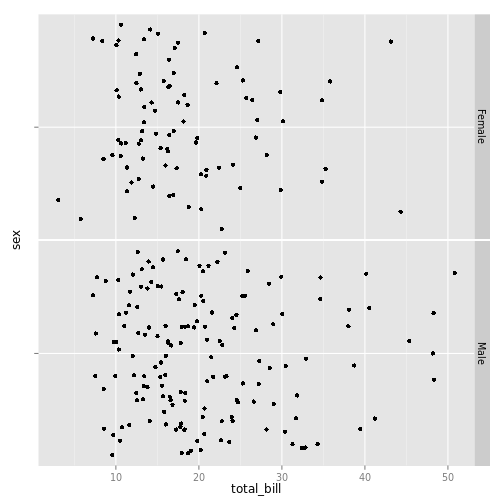
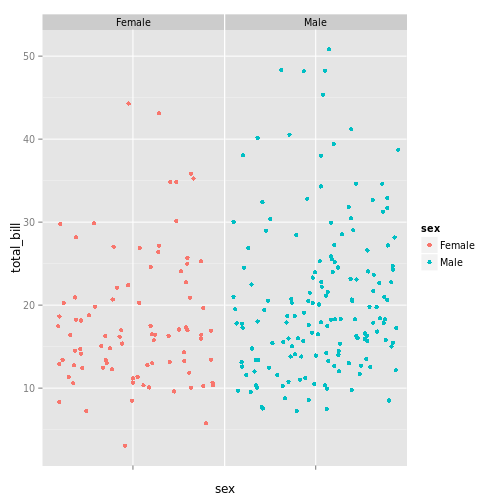
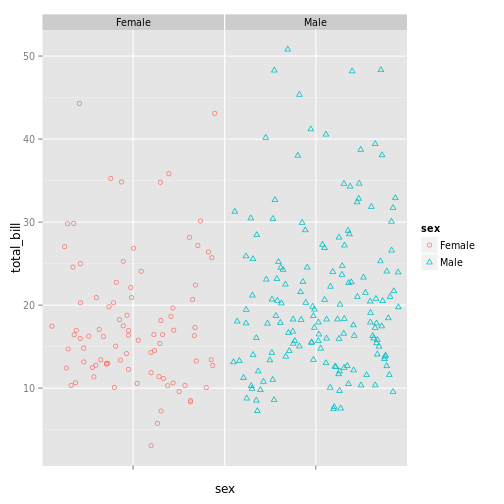
ggally_points
Plots the Scatter Plot
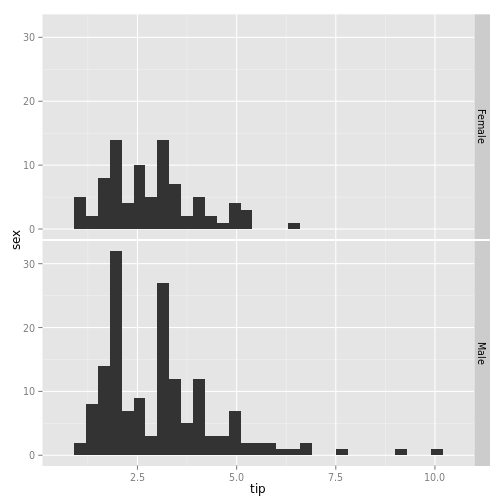
ggally_facethist
Plots the Histograms by Faceting


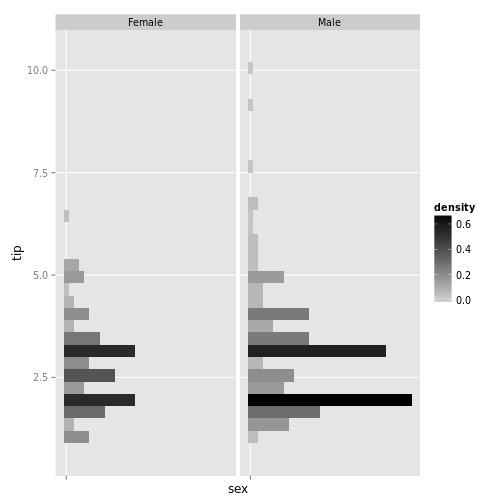
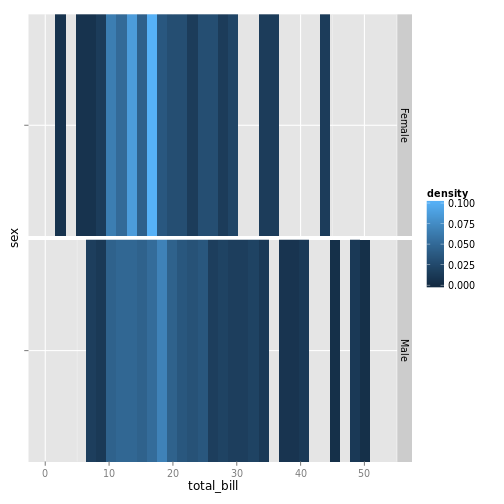
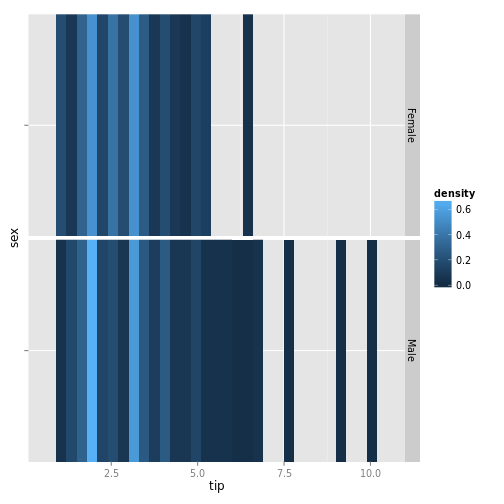
ggally_facetdensitystrip
Plots a density plot with facets or a tile plot with facets


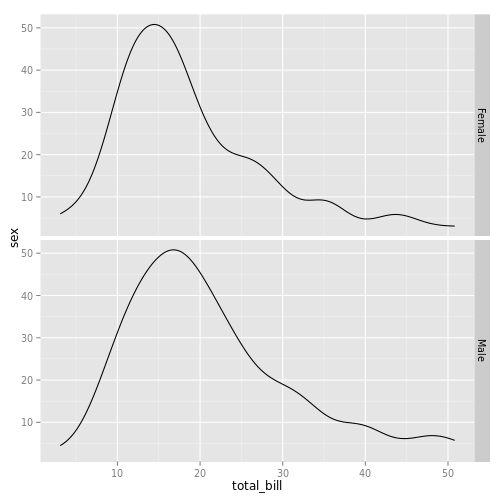
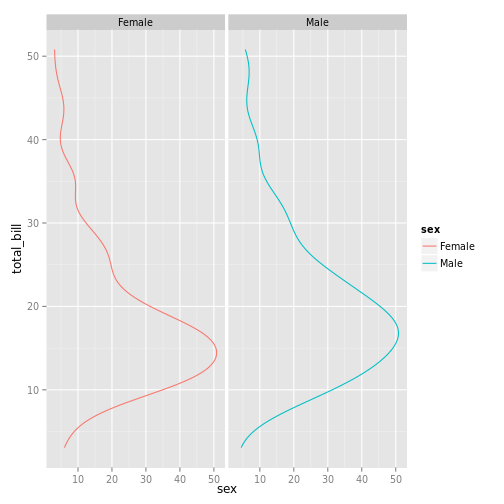
ggally_facetdensity
Plots the density plots by faceting
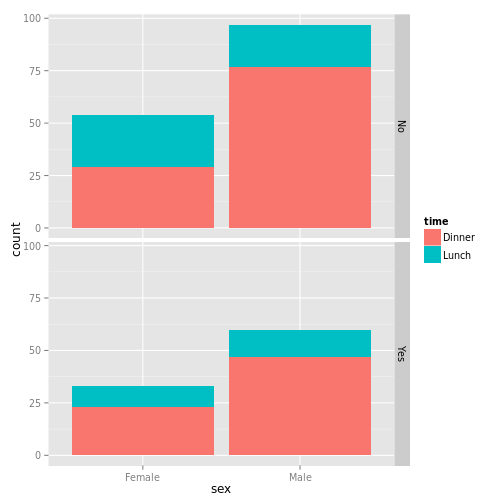
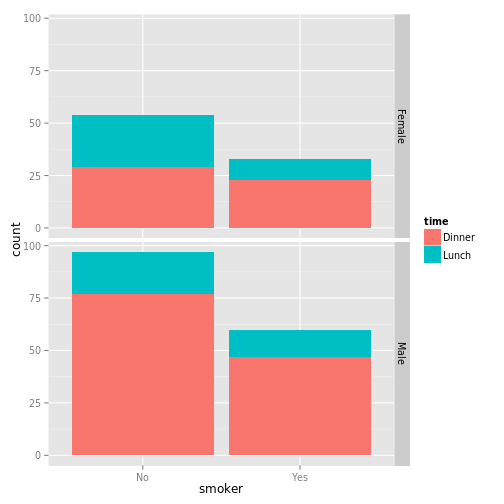
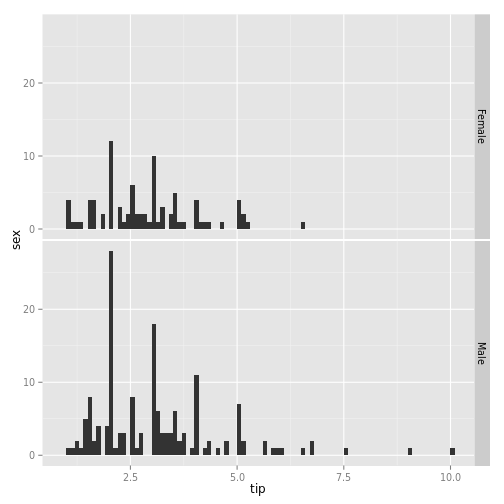
ggally_facetbar
Plots the Bar Plots Faceted by Conditional Variable
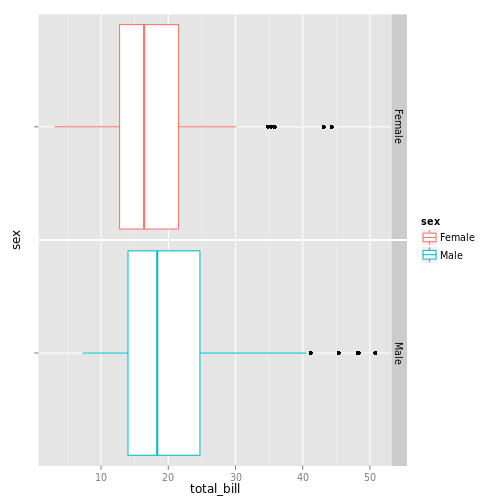
ggally_dotAndBox
Plots either Box Plot or Dot Plots
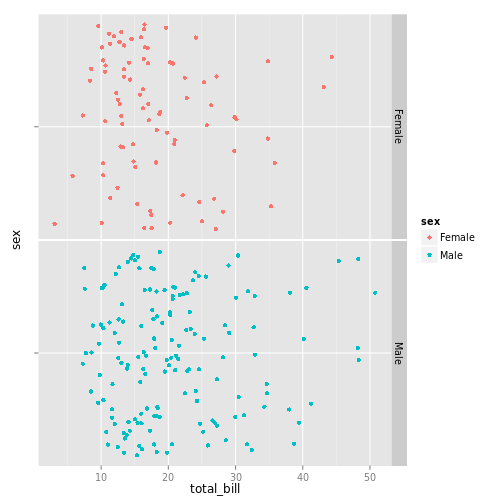
ggally_dot
Plots the Box Plot with Dot
ggally_diagAxis
Internal Axis Labeling Plot for ggpairs


ggally_denstrip
Plots a tile plot with facets
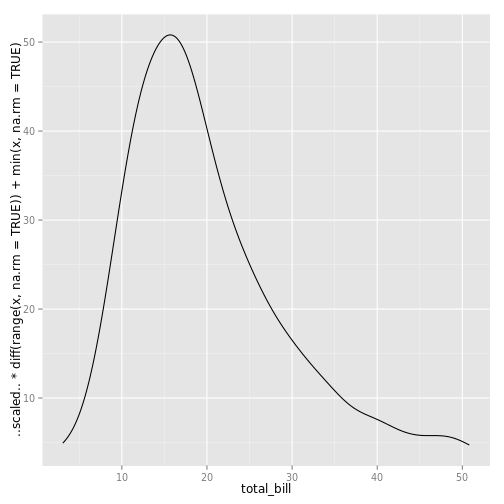
ggally_densityDiag
Plots the Density Plots by Using Diagonal
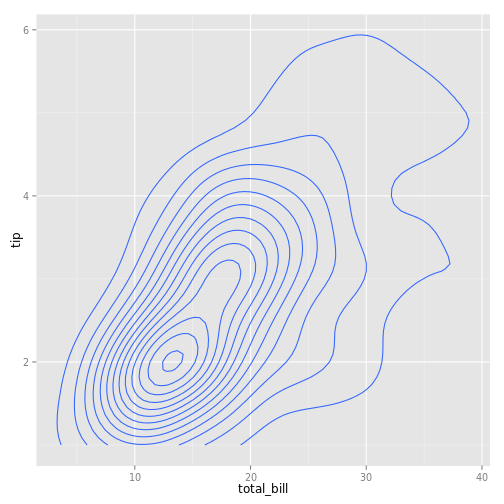

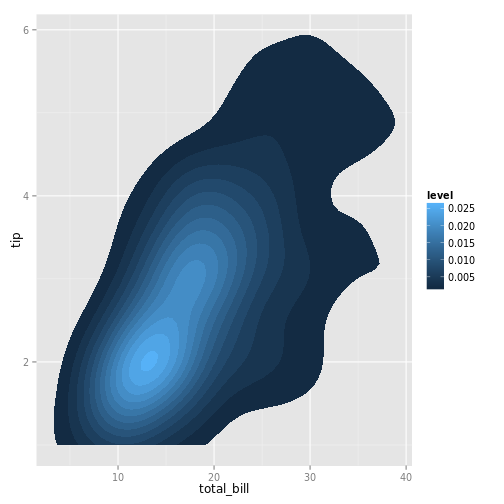
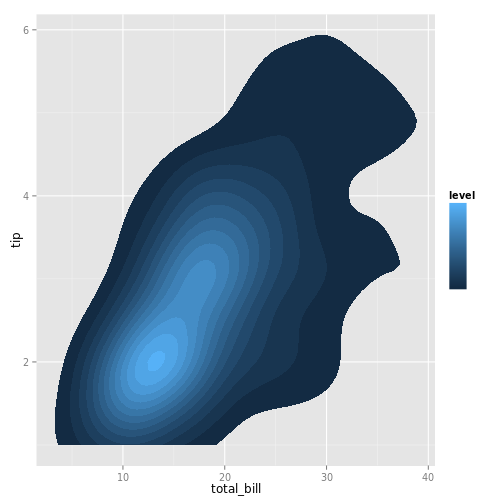
ggally_density
Plots the Scatter Density Plot
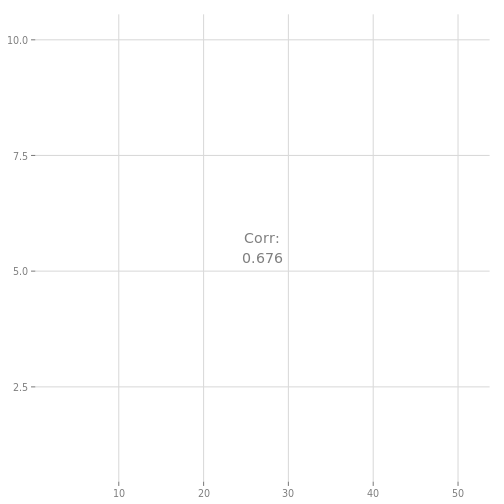
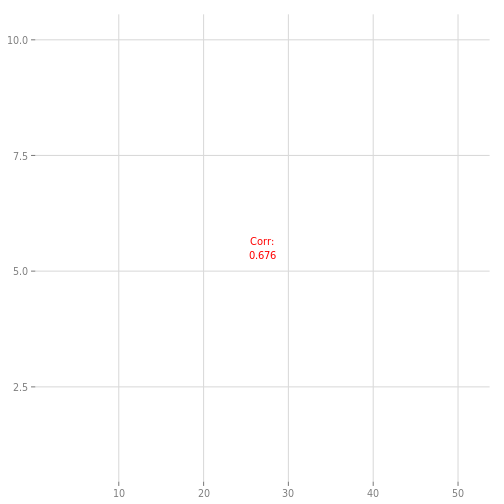
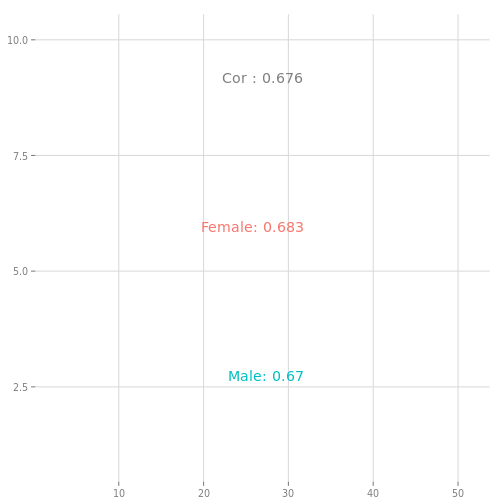
ggally_cor
Correlation from the Scatter Plot
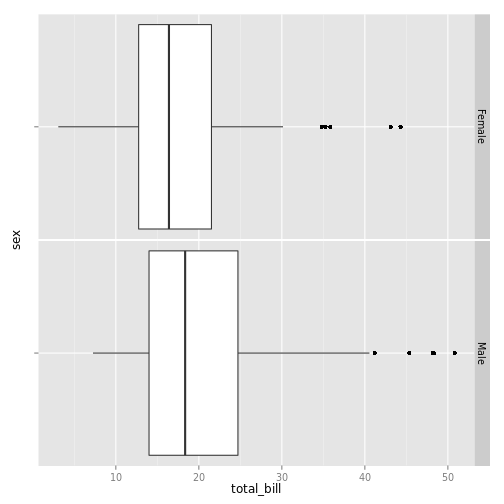

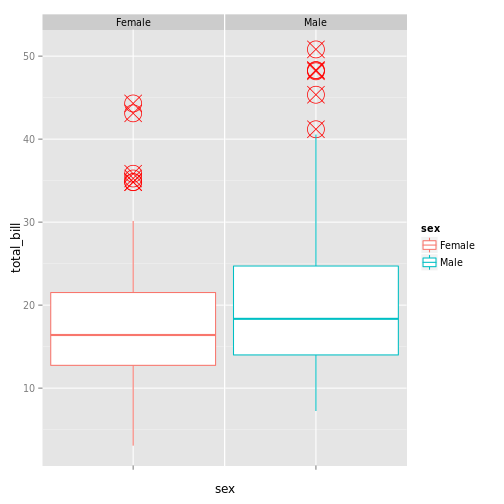
ggally_box
Plots the Box Plot
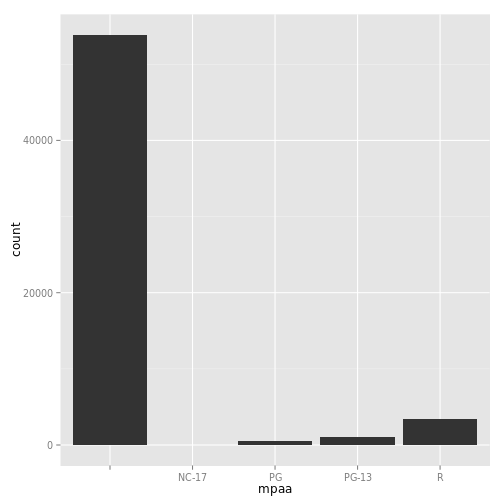
ggally_barDiag
Plots the Bar Plots by Using Diagonal
getPlot
getPlot