theme_nothing
Create a completely empty theme
Create a completely empty theme
Create the default cowplot theme
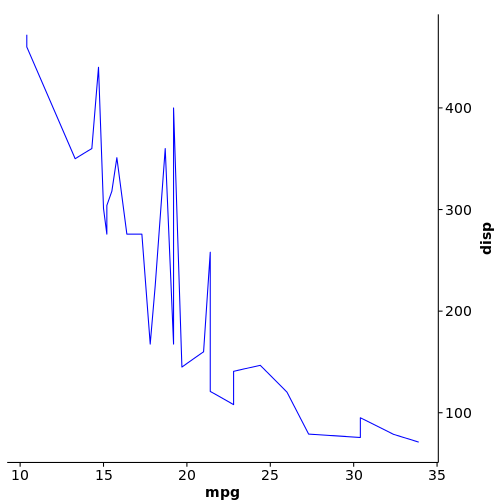
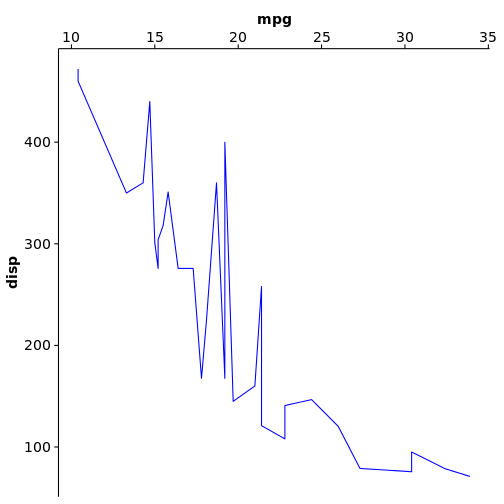
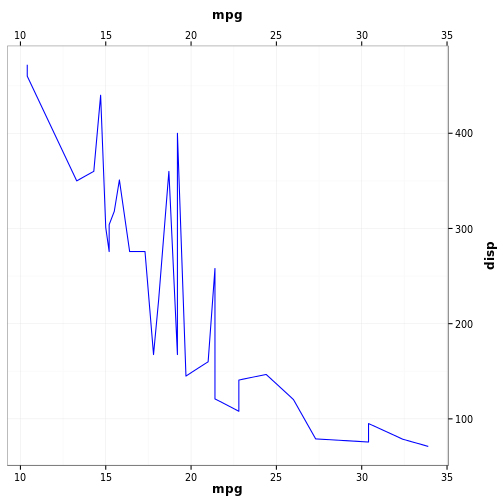
Switches the axis position of the x or y axis in a ggplot2 plot.
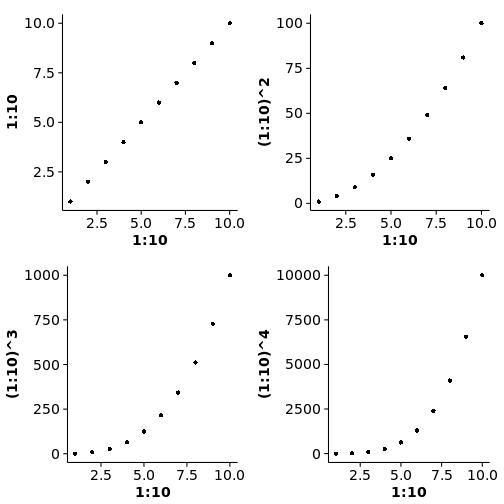
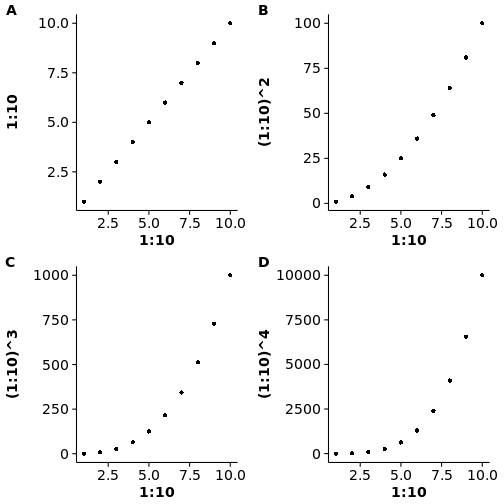
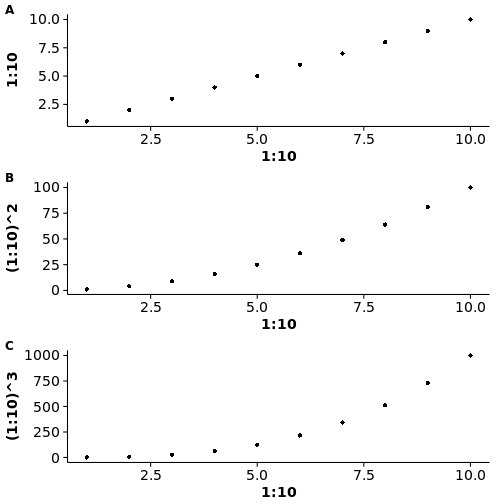
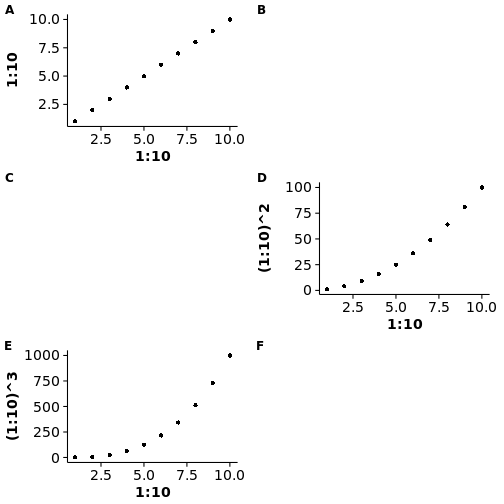
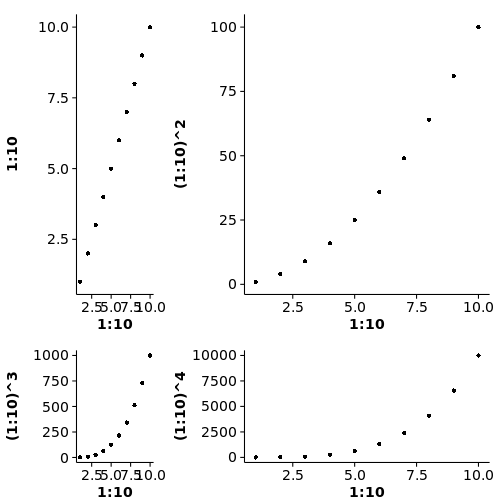
Arrange multiple plots into a grid
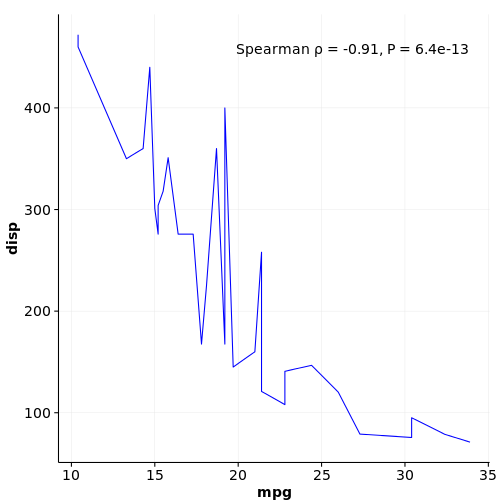
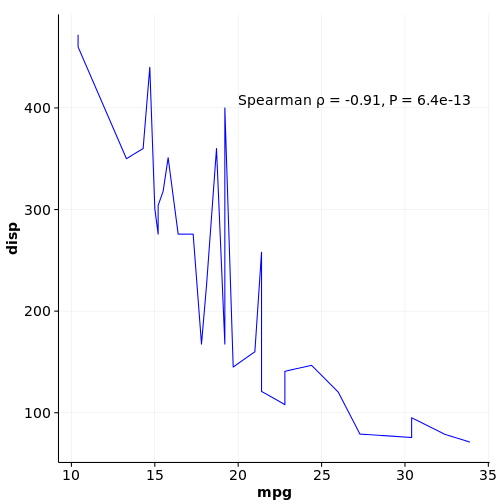
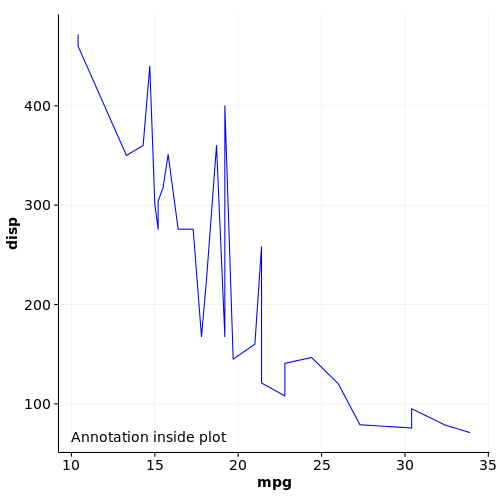
Draw a text label or mathematical expression.
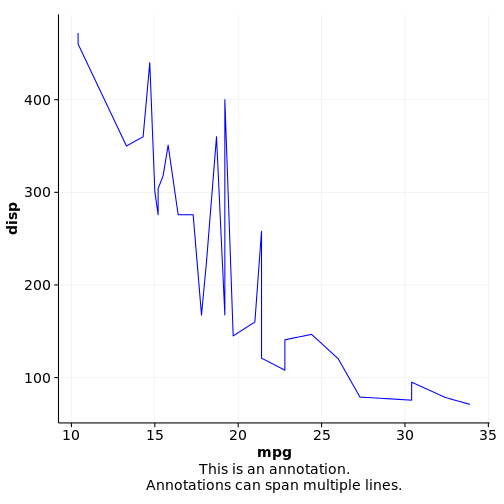
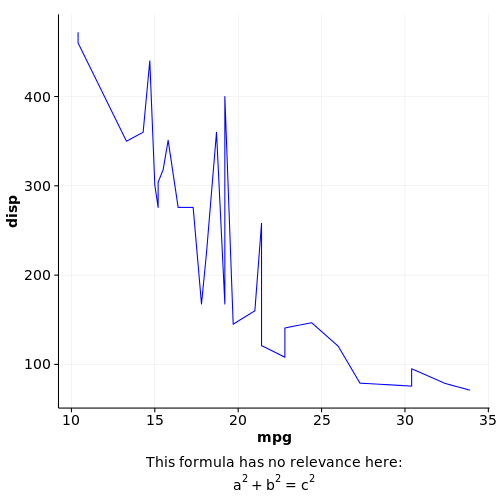
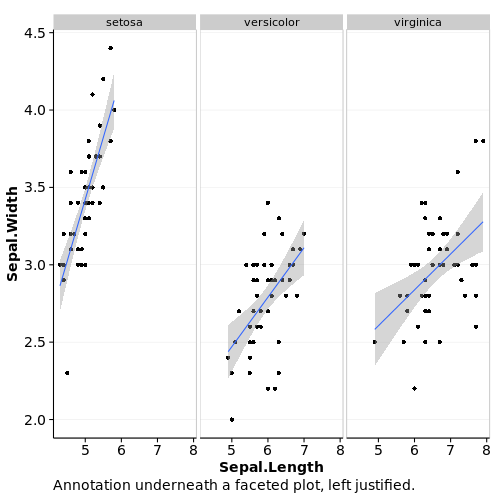
Add annotation underneath a plot
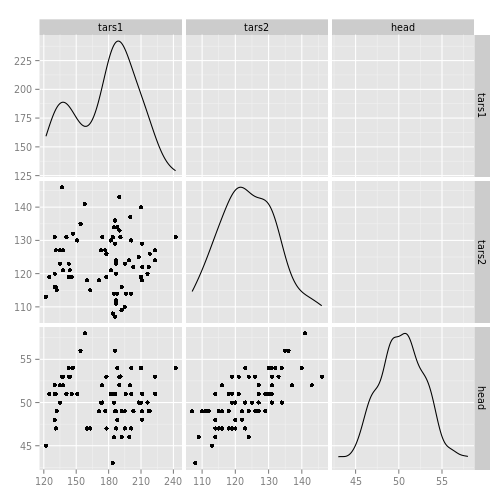
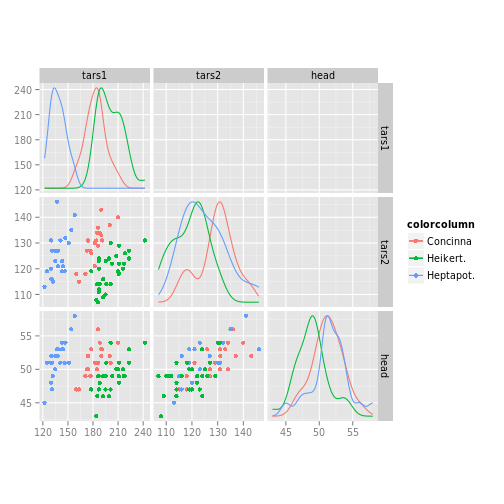
scatmat - plot the lowertriangle plots and density plots of the scatter plot matrix.
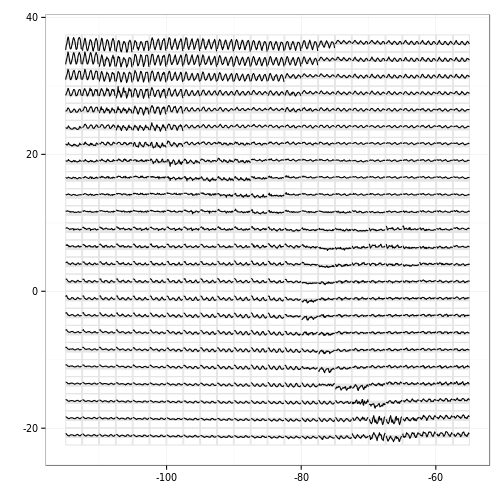
Create the data needed to generate a glyph plot.
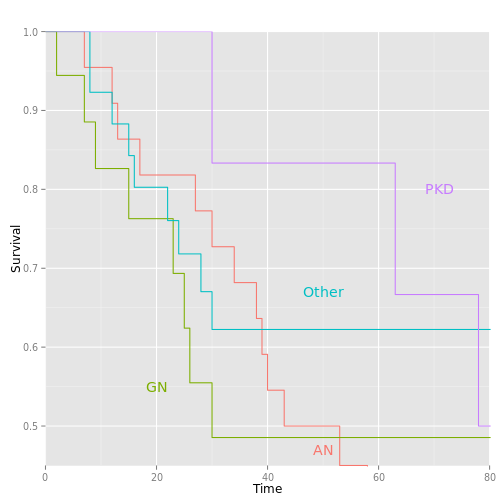
Plot survfit objects using ggplot2
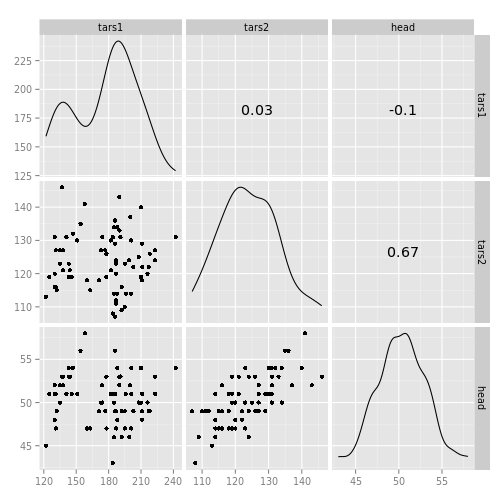
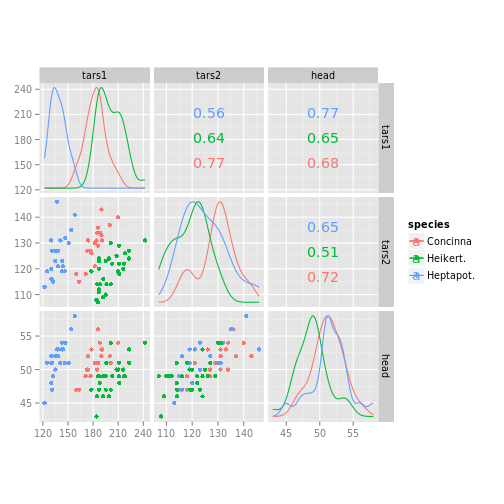
ggscatmat - a traditional scatterplot matrix for purely quantitative variables
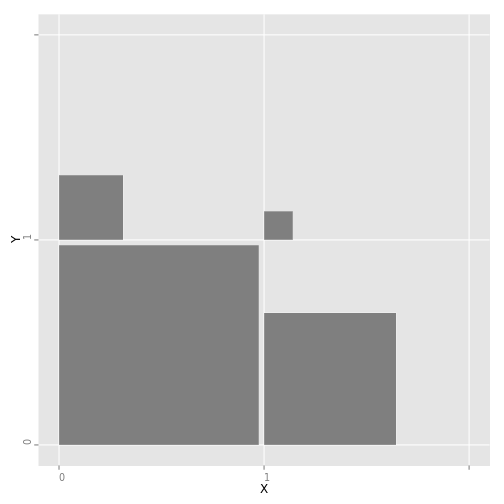

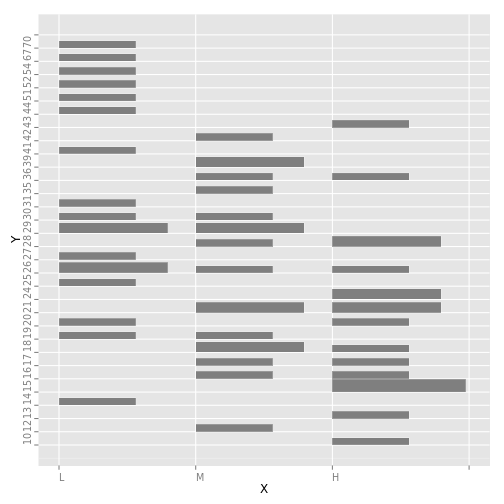
Fluctuation plot
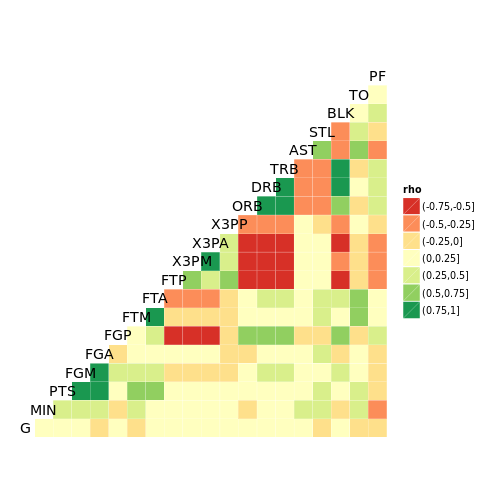
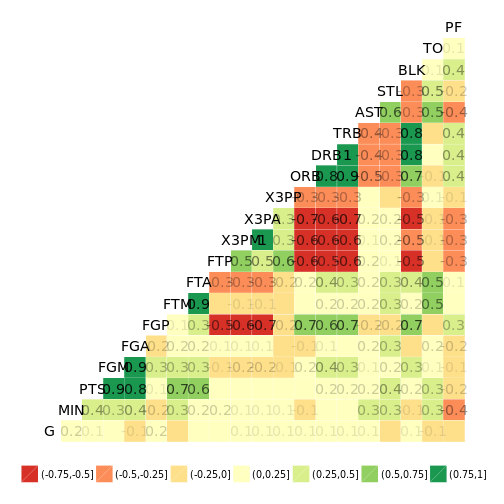
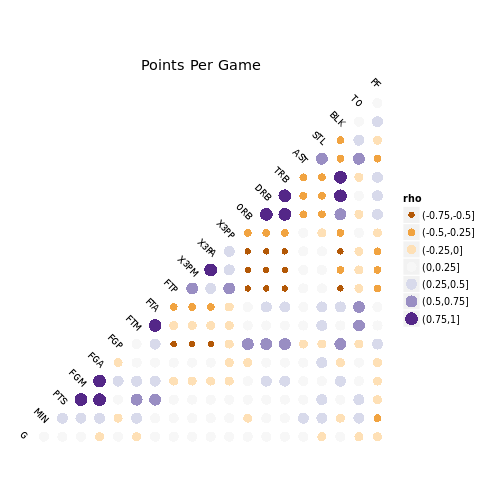
ggcorr - Plot a correlation matrix with ggplot2
GGplot Text

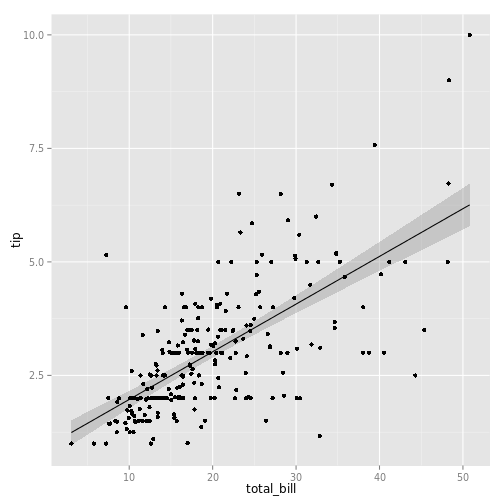
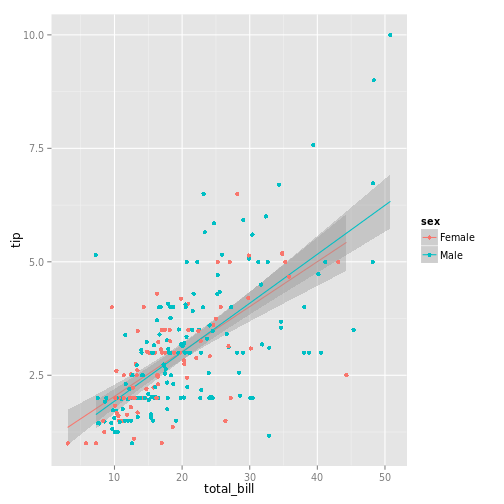
Plots the Scatter Plot with Smoothing
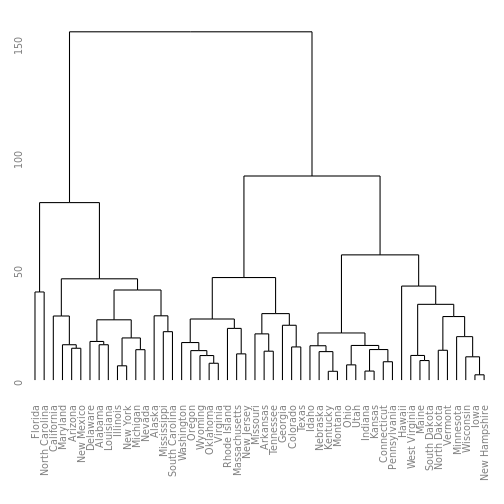
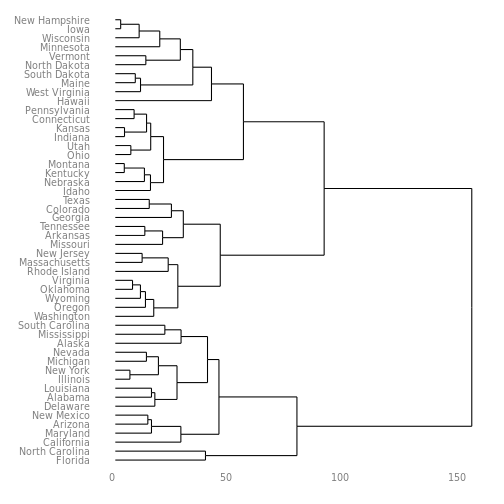
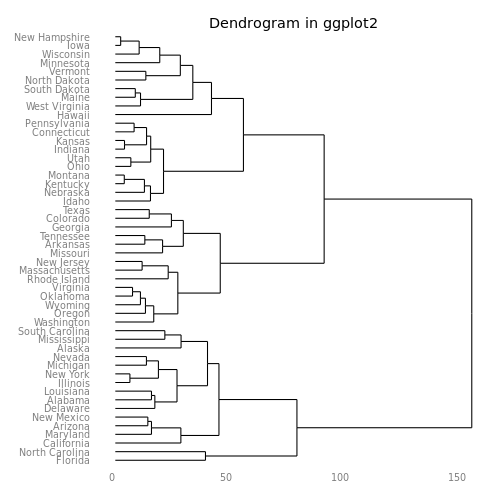
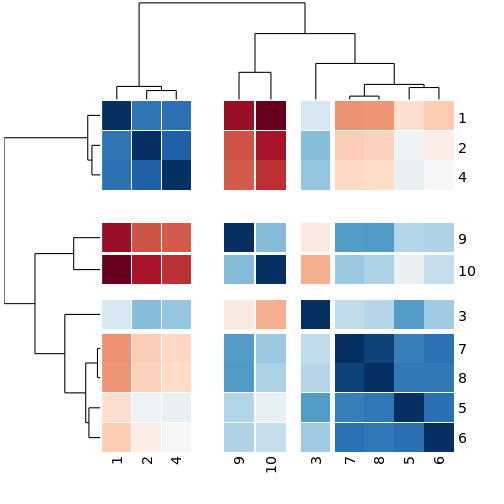
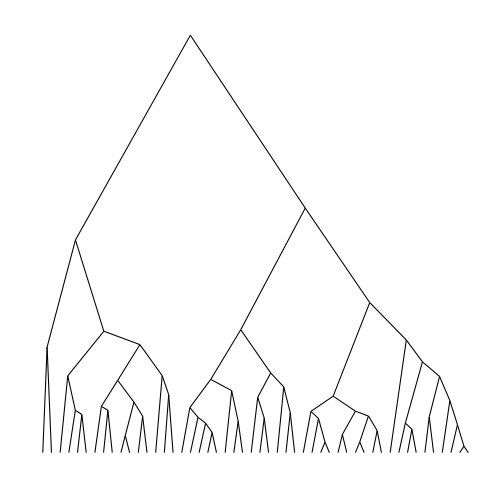
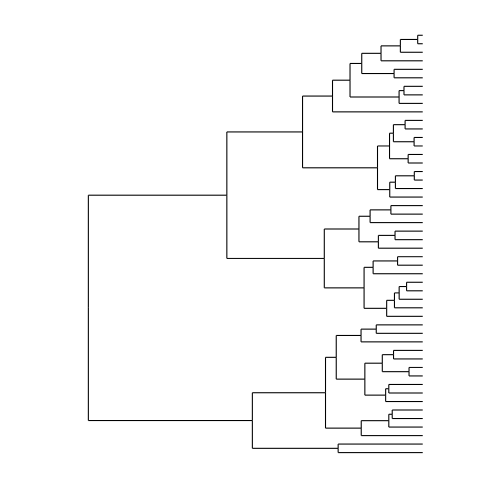
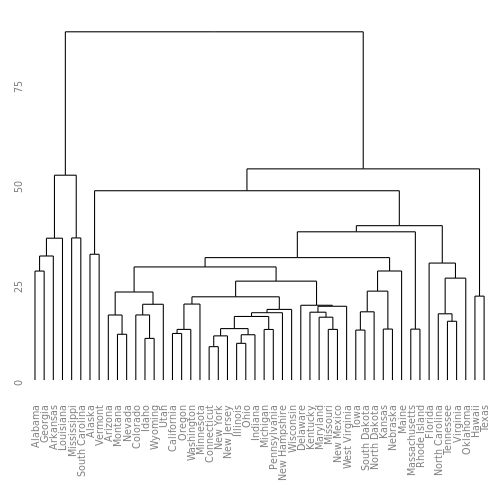
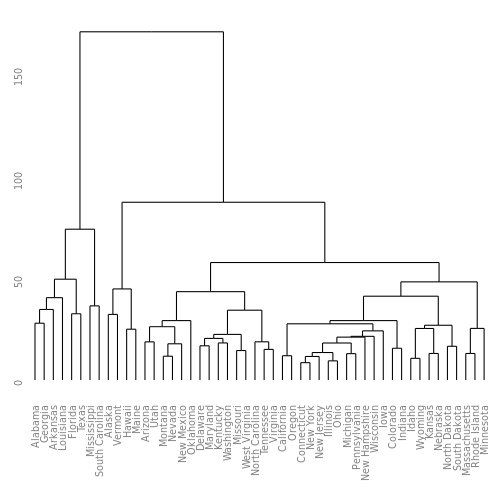
Creates dendrogram plot using ggplot.


Extract cluster data from a model into a list of data frames.