p <- ggplot(mtcars, aes(mpg, disp)) + geom_line(colour = "blue") + background_grid(minor='none')
c <- cor.test(mtcars$mpg, mtcars$disp, method='sp')
## Warning in cor.test.default(mtcars$mpg, mtcars$disp, method = "sp"):
## Cannot compute exact p-value with tieslabel <- substitute(paste("Spearman ", rho, " = ", estimate, ", P = ", pvalue),
list(estimate = signif(c$estimate, 2), pvalue = signif(c$p.value, 2)))
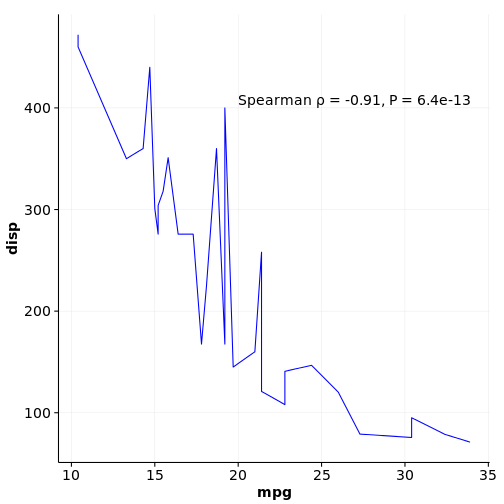
# adding label via ggdraw, in the ggdraw coordinates
ggdraw(p) + draw_label(label, .7, .9)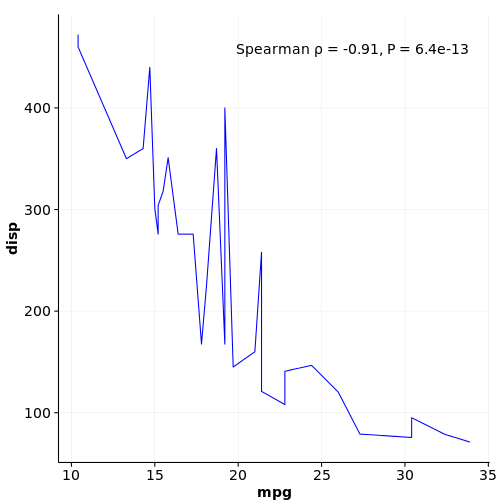
# adding label directly to plot, in the data coordinates
p + draw_label(label, 20, 400, hjust = 0, vjust = 0)