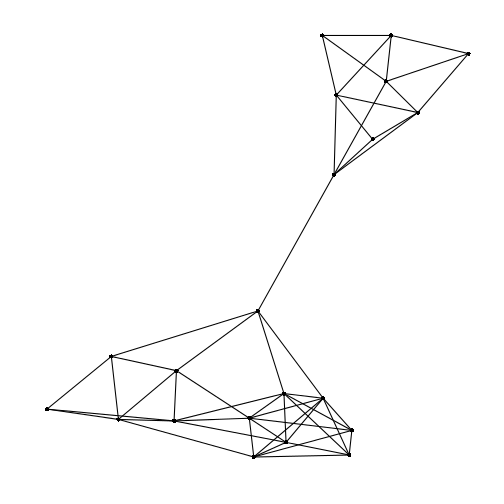
theme_empty
A blank theme for plotting networks
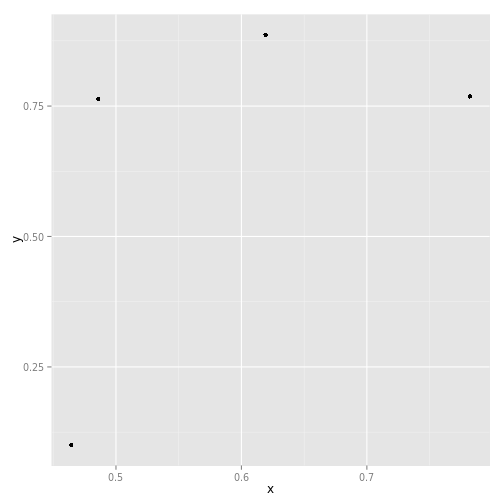
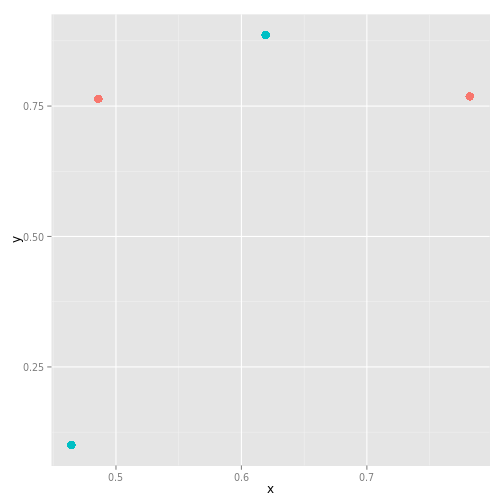
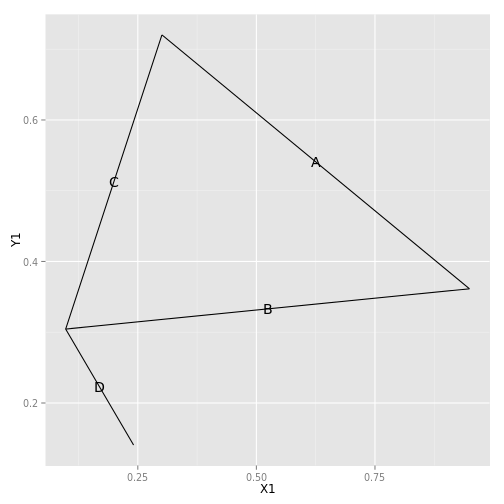
geom_nodeset
Plotting of a population graph edge set using ggplot neumonic
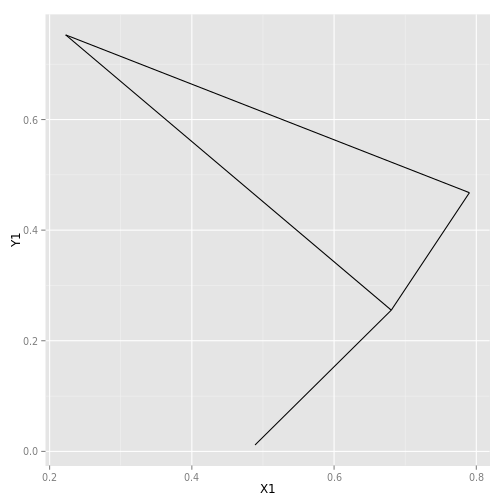
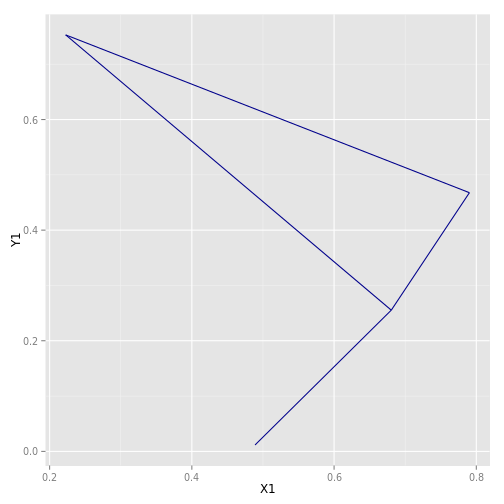
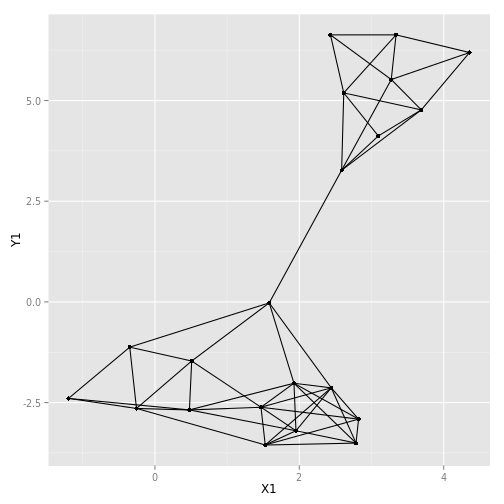
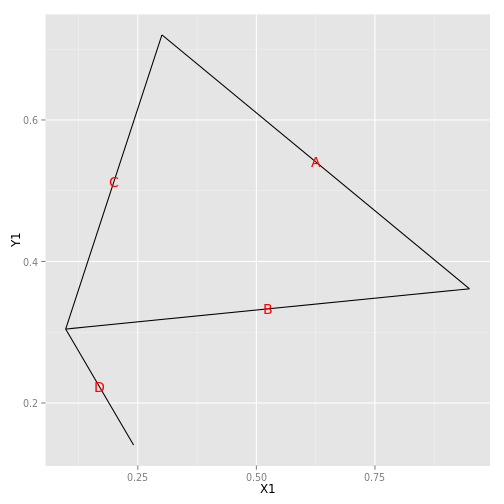
geom_edgeset
Plotting of a population graph edge set using ggplot neumonic
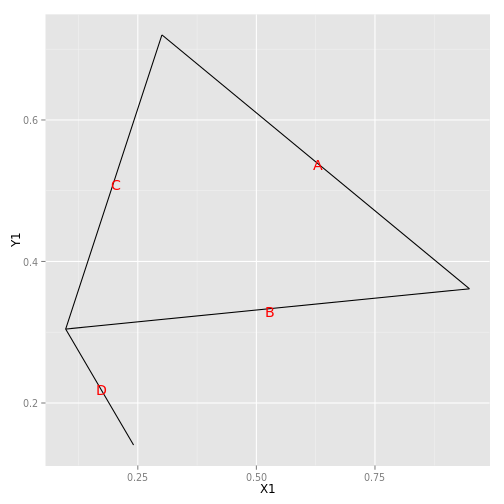
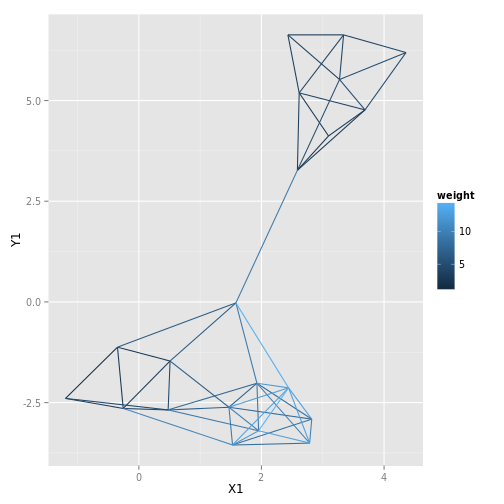
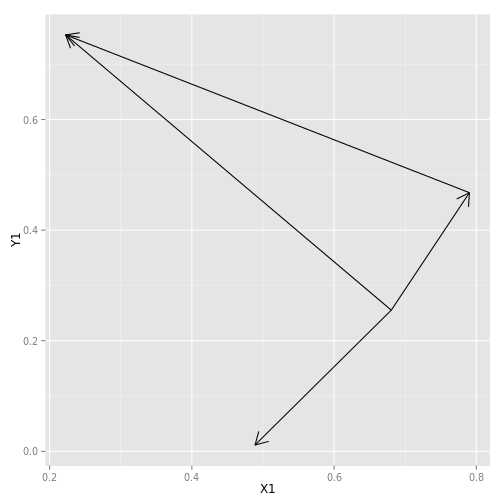
geom_edgelabels
Plotting of a population graph edge labels using ggplot neumonic