plotYearMatrix

Returns the image object to show the heat map of years between the inputted set of vertices
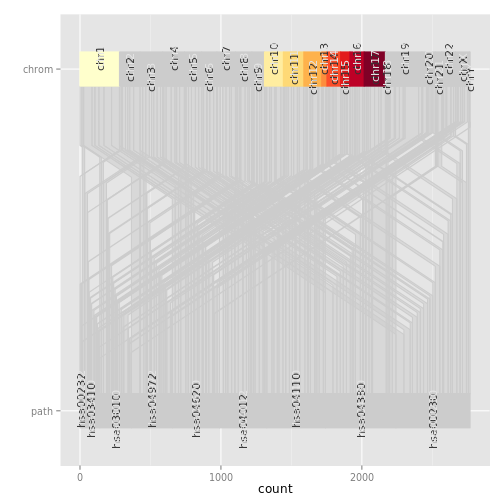
plotPathOnAll

Plot a path between two vertices over the full genealogy
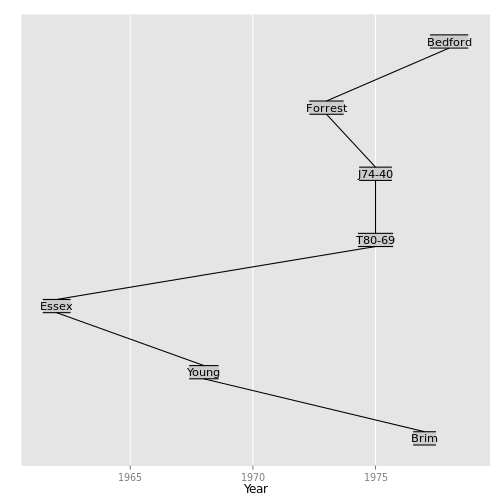
plotPath

Construct the graphic object of the path
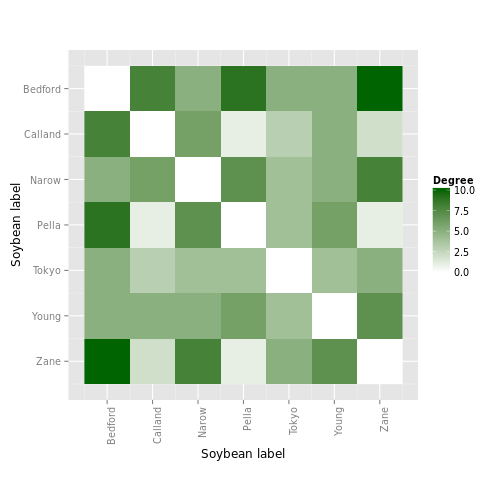
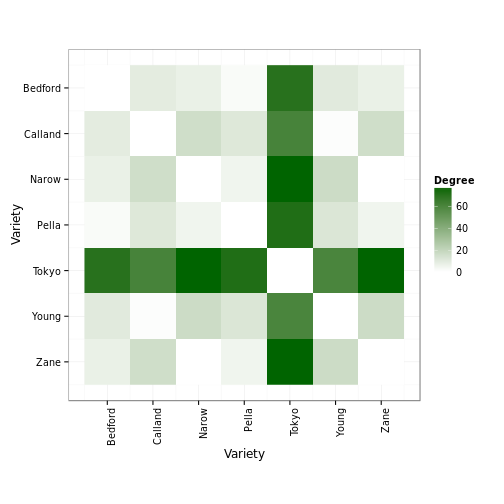
plotDegMatrix

Returns the image object to show the heat map of degrees between the inputted set of vertices
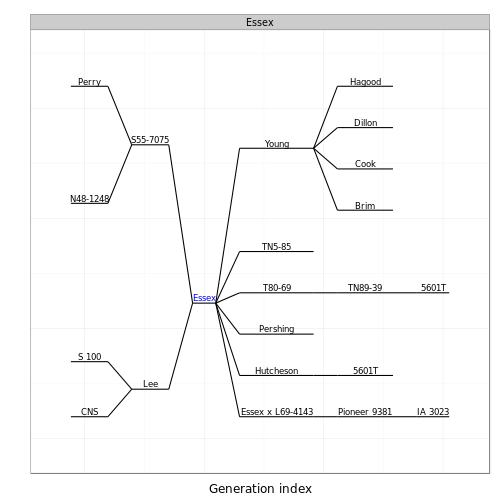
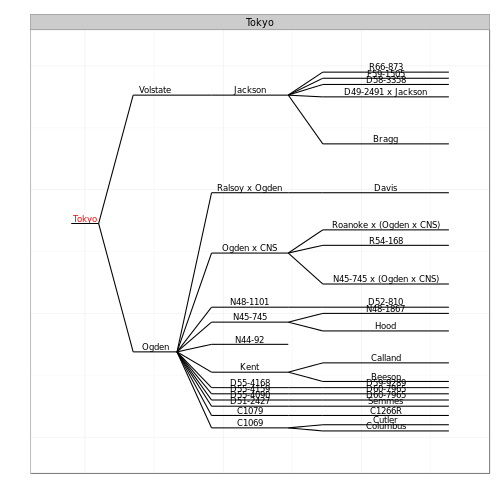
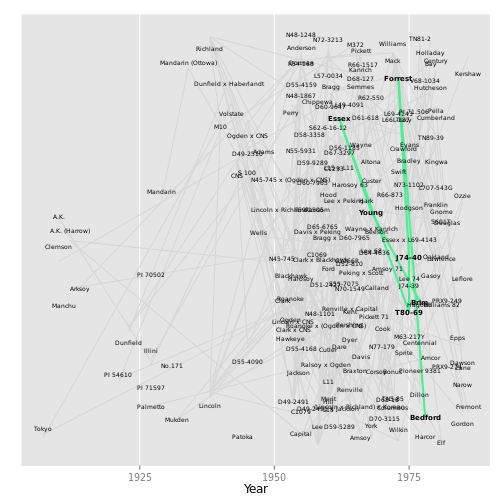
plotAncDes

Returns the image object to show the ancestors and descendants of a variety

ggMarginal

Add marginal density/histogram to ggplot2 scatterplots

gglagplot

Plot time series against lagged versions of themselves

ggcpgram

Plots a cumulative periodogram

ggs_separation

Separation plot for models with binary response variables

ggs_rocplot

Receiver-Operator Characteristic (ROC) plot for models with binary outcomes

ggs_ppsd

Posterior predictive plot comparing the outcome standard deviation vs the distribution of the predicted posterior standard deviations.

ggs_ppmean

Posterior predictive plot comparing the outcome mean vs the distribution of the predicted posterior means.

ggs_pairs

Create a plot matrix of posterior simulations

genes

Data linking genes and pathways.