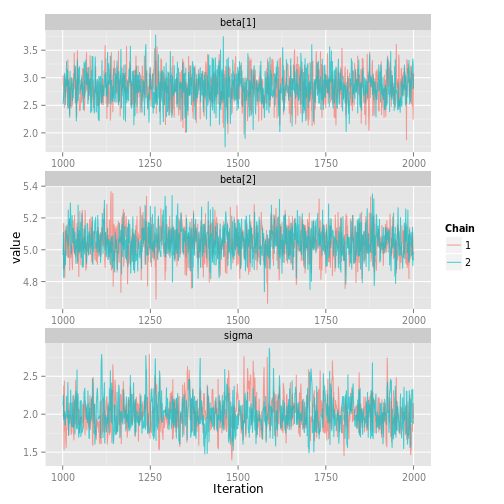
ggs_traceplot
Traceplot of the chains
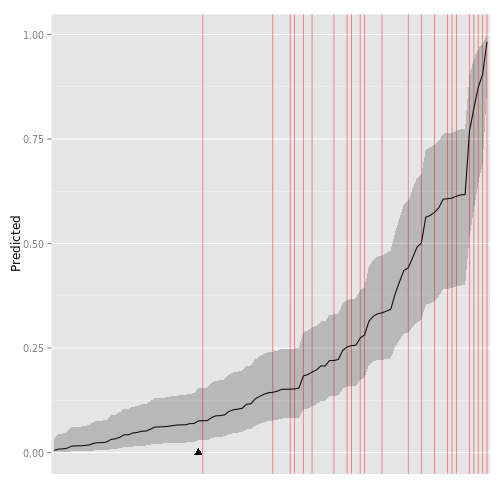
ggs_separation
Separation plot for models with binary response variables
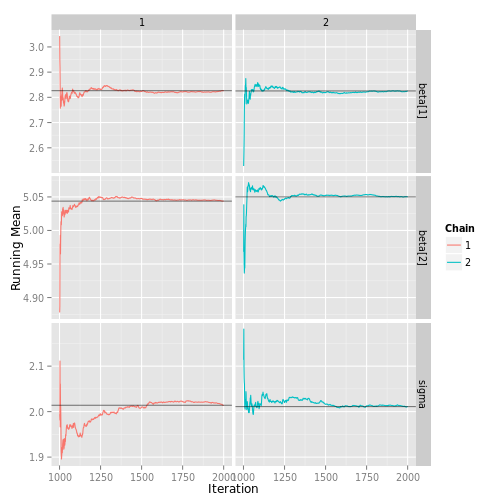
ggs_running
Running means of the chains
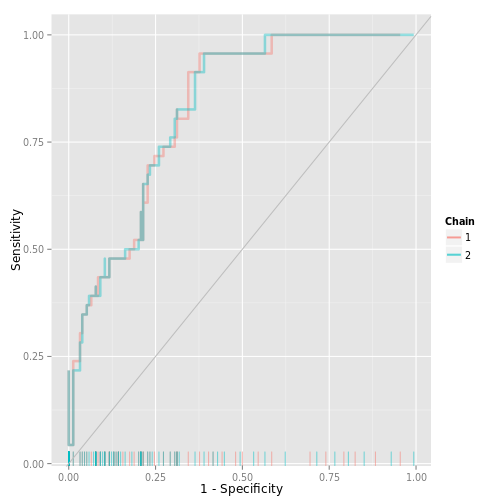
ggs_rocplot
Receiver-Operator Characteristic (ROC) plot for models with binary outcomes
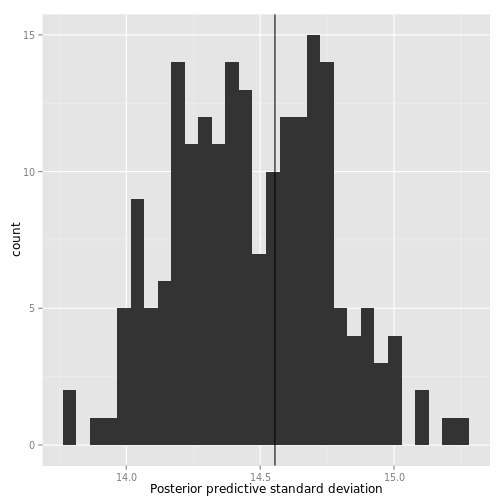
ggs_ppsd
Posterior predictive plot comparing the outcome standard deviation vs the distribution of the predicted posterior standard deviations.
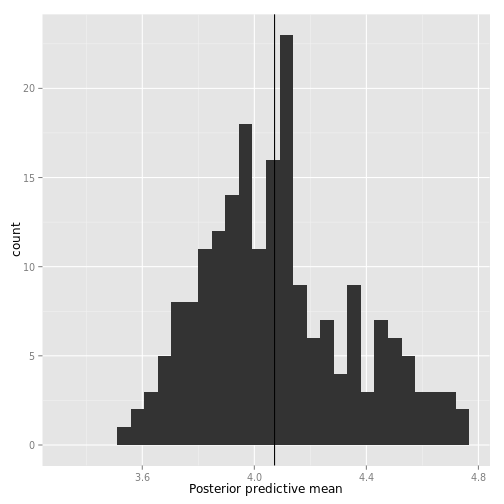
ggs_ppmean
Posterior predictive plot comparing the outcome mean vs the distribution of the predicted posterior means.
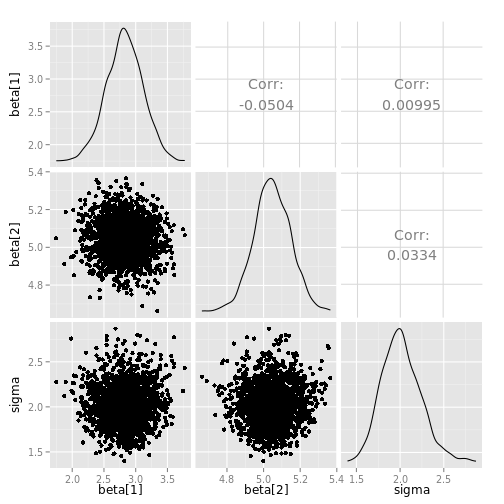
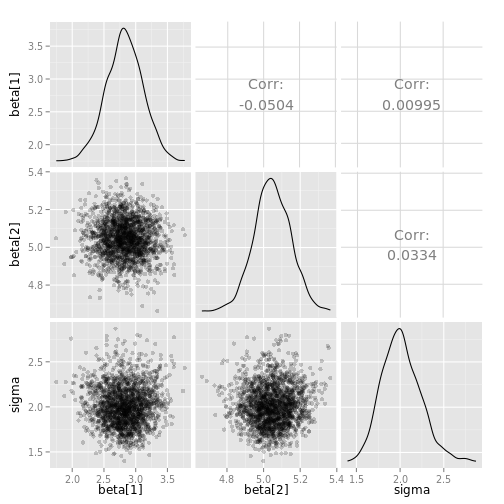
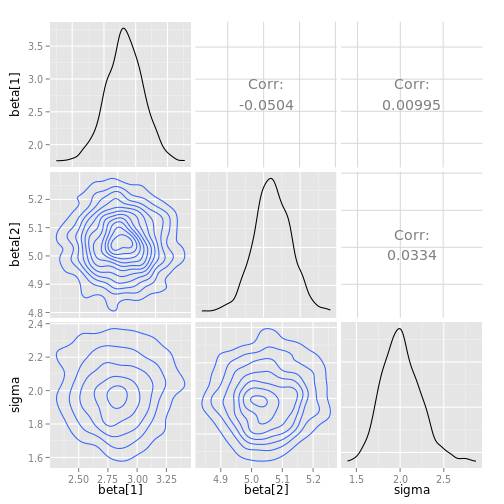
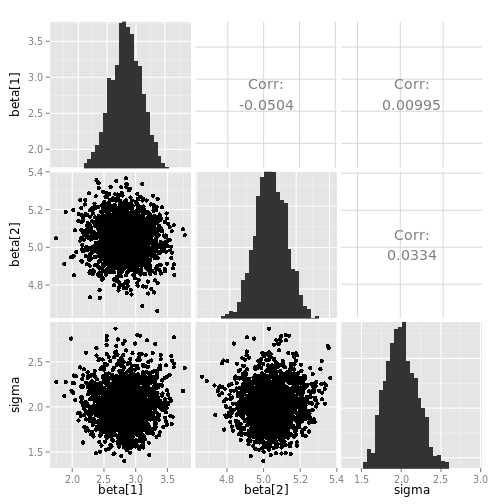
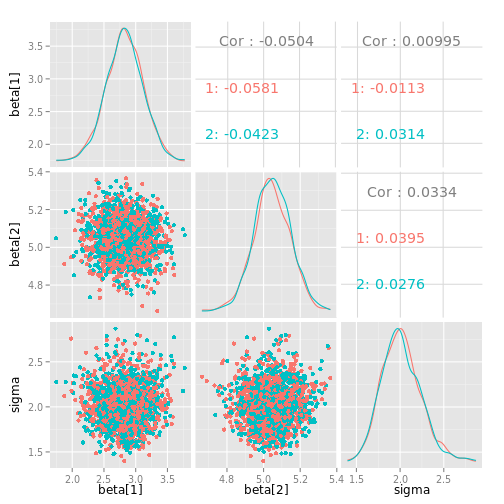
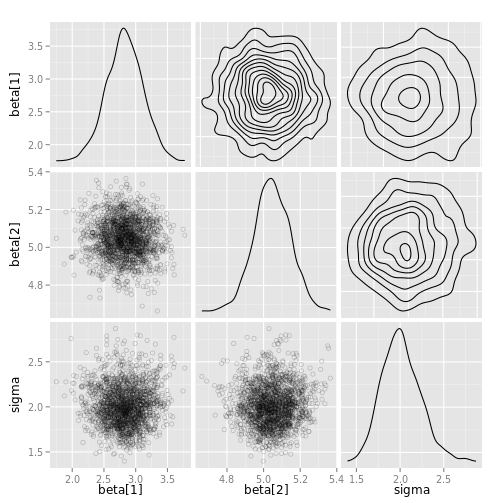
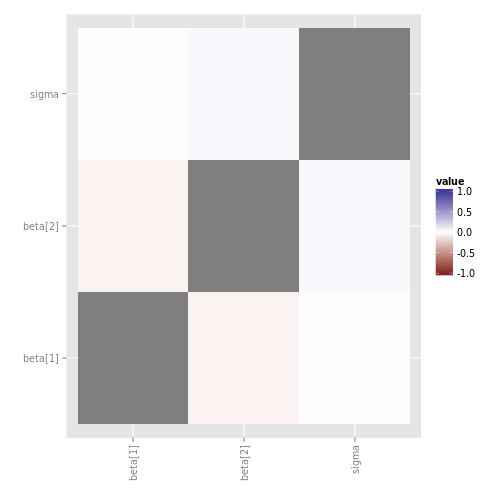
ggs_pairs
Create a plot matrix of posterior simulations
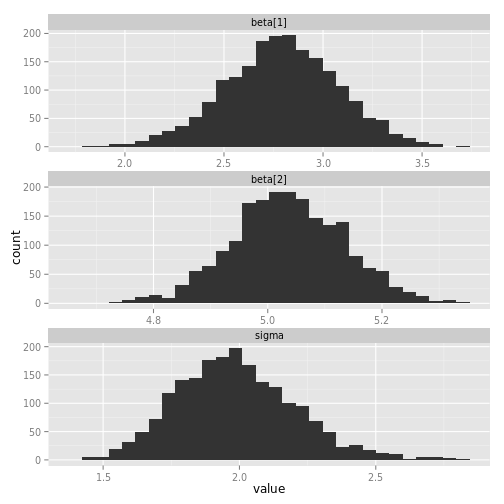
ggs_histogram
Histograms of the paramters.
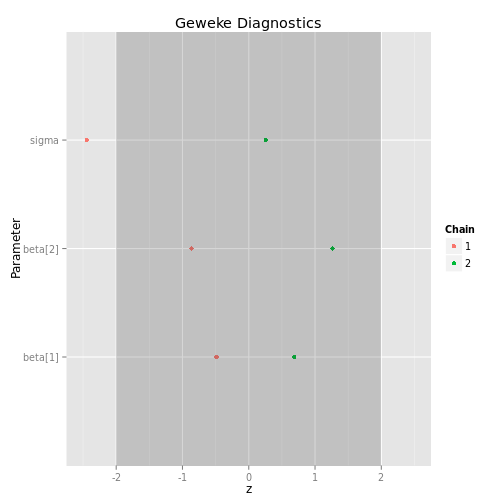
ggs_geweke
Dotplot of the Geweke diagnostic, the standard Z-score
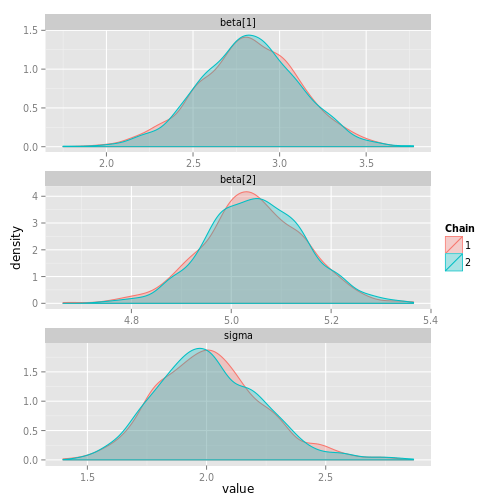
ggs_density
Density plots of the chains
ggs_crosscorrelation
Plot the Cross-correlation between-chains
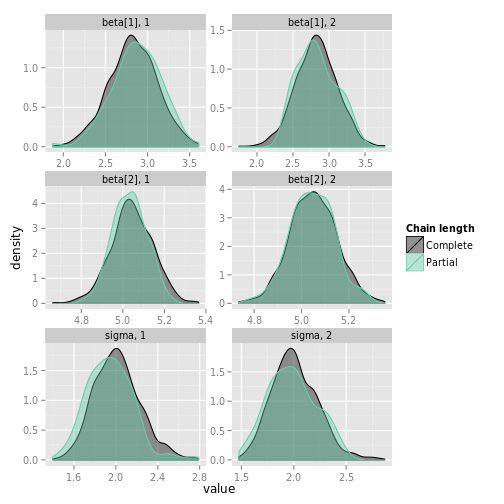
ggs_compare_partial
Density plots comparing the distribution of the whole chain with only its last part.
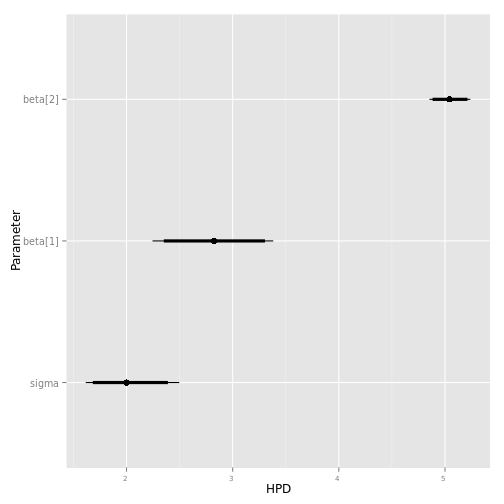
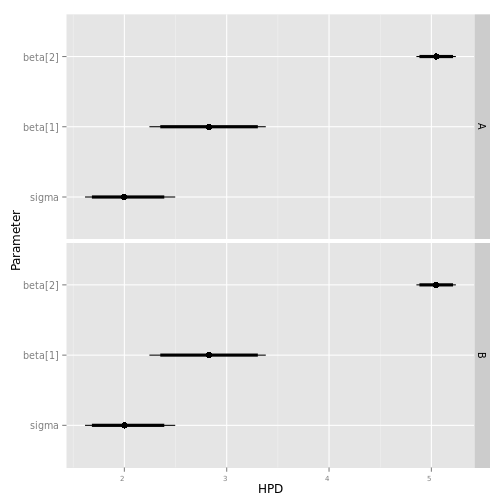
ggs_caterpillar
Caterpillar plot with thick and thin CI
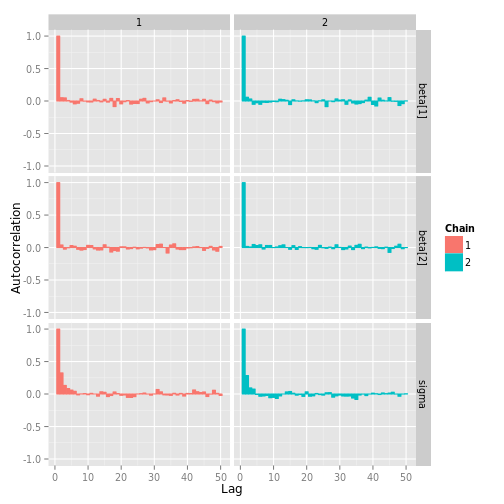
ggs_autocorrelation
Plot an autocorrelation matrix
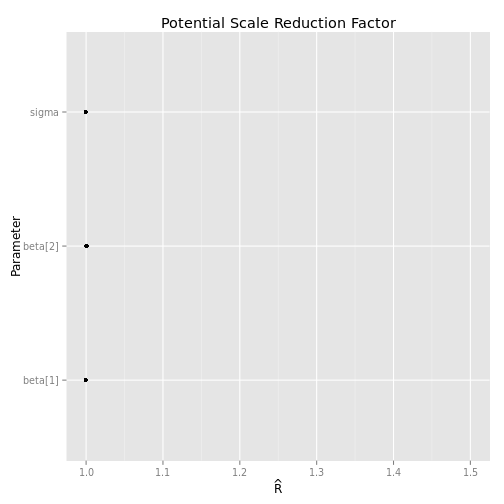
ggs_Rhat
Dotplot of Potential Scale Reduction Factor (Rhat)