data(sbGeneal)
ig = dfToIG(sbGeneal)
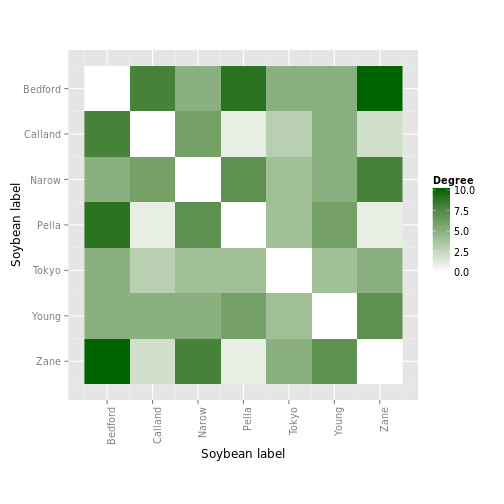
varieties=c("Bedford", "Calland", "Narow", "Pella", "Tokyo", "Young", "Zane")
p = plotDegMatrix(varieties, ig, sbGeneal, "Soybean label", "Soybean label", "Degree")
p + ggplot2::scale_fill_continuous(low="white", high="darkgreen")