library(igraph)
a <- matrix( c(0,1,0,1,1,0,0,1,0,0,0,1,1,1,1,0),nrow=4)
rownames(a) <- colnames(a) <- LETTERS[1:4]
graph <- as.popgraph(a)
igraph::V(graph)$x <- runif(4)
igraph::V(graph)$y <- runif(4)
require(ggplot2)
ggplot() + geom_nodeset( aes(x=x,y=y), graph )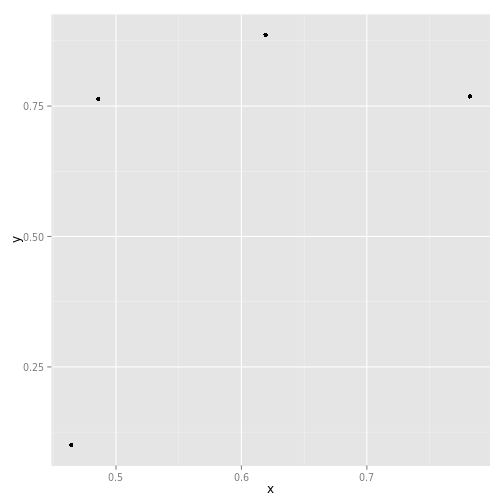
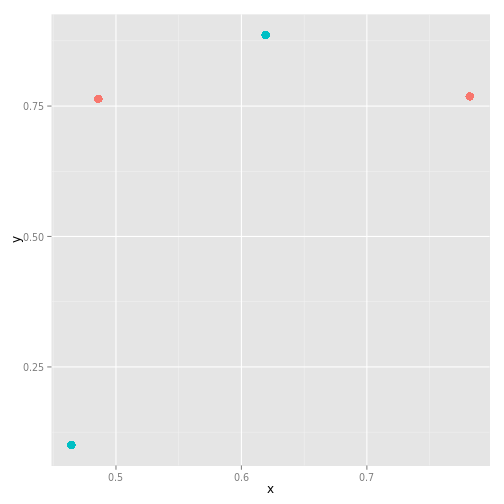
igraph::V(graph)$group <- c("A","A","B","B")
ggplot() + geom_nodeset( aes(x=x,y=y,color=group), graph, size=4 )