a <- matrix( c(0,1,0,1,1,0,0,1,0,0,0,1,1,1,1,0),nrow=4)
rownames(a) <- colnames(a) <- LETTERS[1:4]
graph <- as.popgraph(a)
igraph::V(graph)$x <- runif(4)
igraph::V(graph)$y <- runif(4)
igraph::E(graph)$Label <- LETTERS[1:4]
require(ggplot2)
p <- ggplot() + geom_edgeset( aes(x=x,y=y), graph )
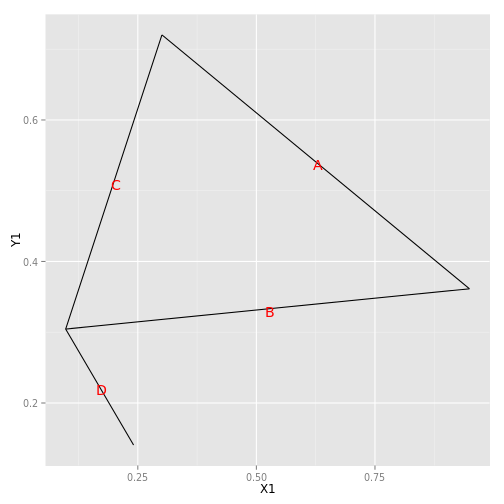
p + geom_edgelabels(aes(x=x,y=y,label=Label),graph)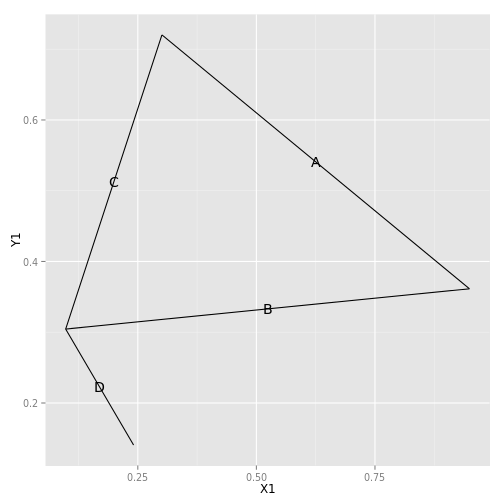
p + geom_edgelabels(aes(x=x,y=y,label=Label),graph,color="red")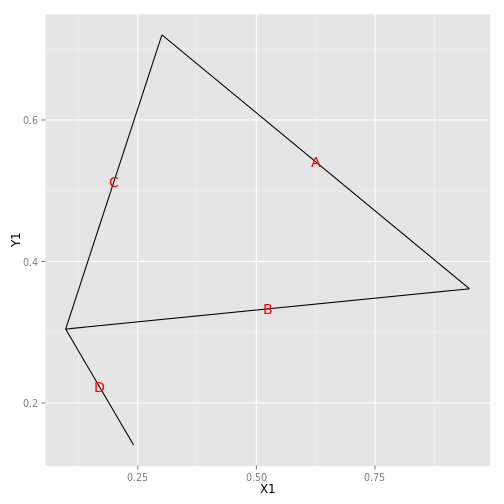
p + geom_edgelabels(aes(x=x,y=y,label=Label),graph,color="red", offset=c(.005,-0.004))