data(nasa)
nasaLate <- nasa[nasa$date >= as.POSIXct("1998-01-01"), ]
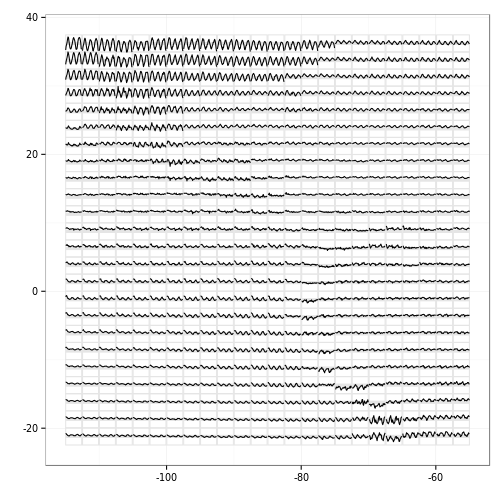
temp.gly <- glyphs(nasaLate, "long", "day", "lat", "surftemp", height=2.5)## Using width 2.38ggplot2::ggplot(temp.gly, ggplot2::aes(gx, gy, group = gid)) +
add_ref_lines(temp.gly, color = "grey90") +
add_ref_boxes(temp.gly, color = "grey90") +
ggplot2::geom_path() +
ggplot2::theme_bw() +
ggplot2::labs(x = "", y = "")