p1 <- ggplot(mtcars, aes(mpg, disp)) + geom_line(colour = "blue") + background_grid(minor='none')
ggdraw(add_sub(p1, "This is an annotation.\nAnnotations can span multiple lines."))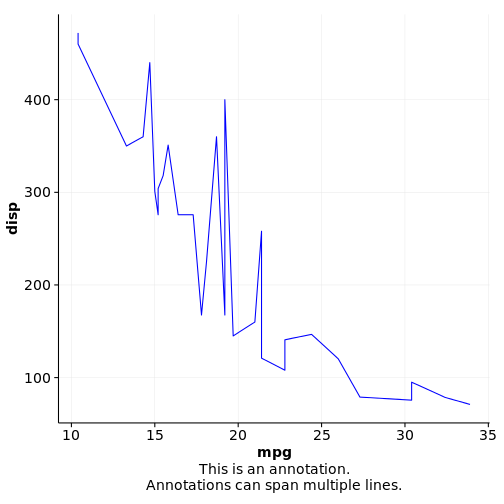
# You can also do this repeatedly. Just be aware that new annotations are added above previous ones:
p2 <- add_sub(p1, expression(paste(a^2+b^2, " = ", c^2)))
p3 <- add_sub(p2, "This formula has no relevance here:", y  = 0, vjust = 0)
ggdraw(p3)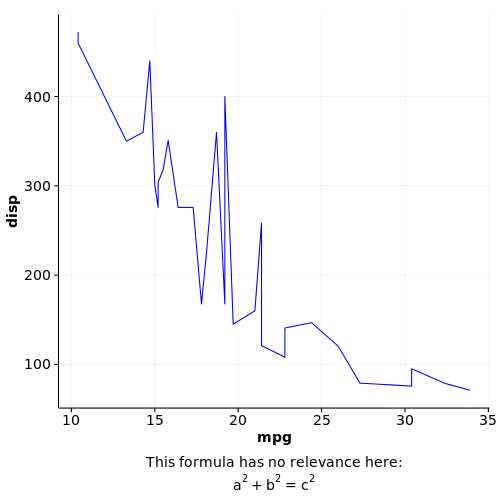
#This code also works with faceted plots:
plot.iris <- ggplot(iris, aes(Sepal.Length, Sepal.Width)) +
  geom_point() + facet_grid(. ~ Species) + stat_smooth(method = "lm") +
  background_grid(major = 'y', minor = "none") + # add thin horizontal lines
  panel_border() # and a border around each panel
p2 <- add_sub(plot.iris, "Annotation underneath a faceted plot, left justified.", x = 0, hjust = 0)
ggdraw(p2)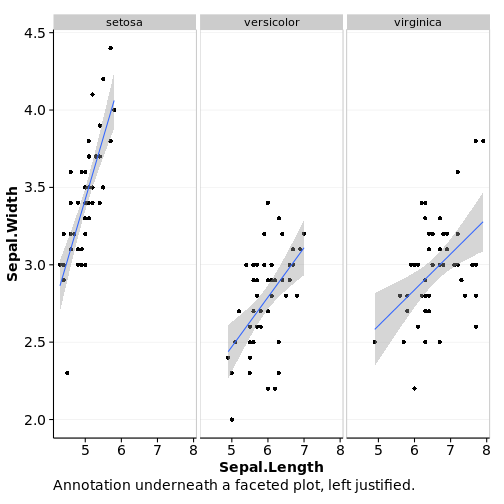
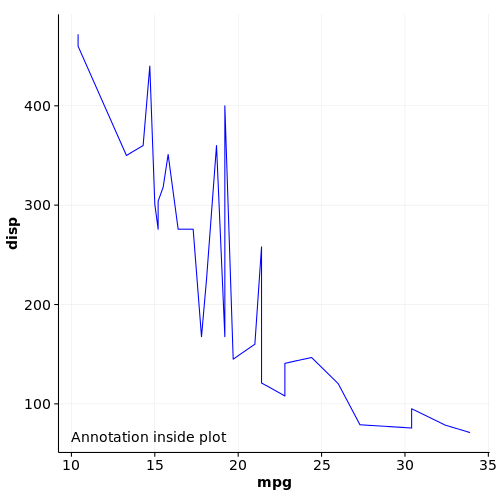
# Finally, it is possible to move the annotation inside of the plot if desired.
ggdraw(add_sub(p1, "Annotation inside plot", vpadding=grid::unit(0, "lines"),
       y = 6, x = 0.03, hjust = 0))