data(mtcars)
ggally_points(mtcars, mapping = ggplot2::aes(x = disp, y = hp))
ggally_points(mtcars, mapping = ggplot2::aes_string(x = "disp", y = "hp"))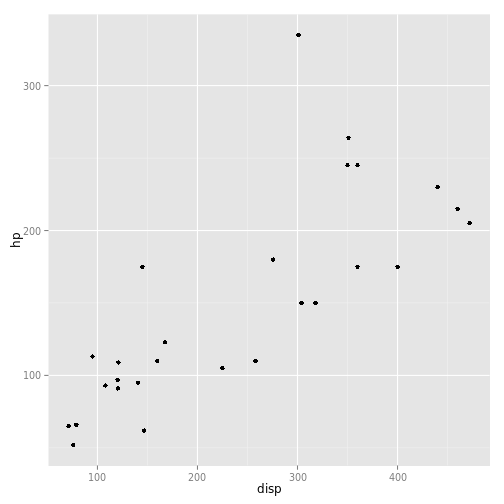
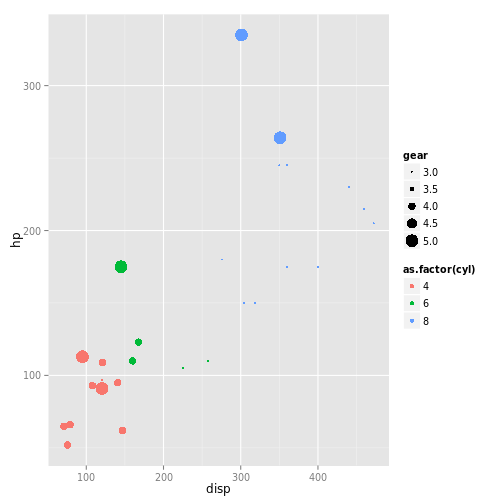
ggally_points(
  mtcars,
  mapping = ggplot2::aes_string(
    x     = "disp",
    y     = "hp",
    color = "as.factor(cyl)",
    size  = "gear"
  )
)