# prepare data for dichotomous likert scale, 5 items
likert_2 <- data.frame(
  as.factor(sample(1:2, 500, replace = TRUE, prob = c(0.3,0.7))),
  as.factor(sample(1:2, 500, replace = TRUE, prob = c(0.6,0.4))),
  as.factor(sample(1:2, 500, replace = TRUE, prob = c(0.25,0.75))),
  as.factor(sample(1:2, 500, replace = TRUE, prob = c(0.9,0.1))),
  as.factor(sample(1:2, 500, replace = TRUE, prob = c(0.35,0.65))))

# create labels
levels_2 <- c("Agree", "Disagree")

# prepare data for 4-category likert scale, with neutral category 5 items
Q1 <- as.factor(sample(1:4, 500, replace = TRUE, prob = c(0.2, 0.3, 0.1, 0.4)))
Q2 <- as.factor(sample(1:4, 500, replace = TRUE, prob = c(0.5, 0.25, 0.15, 0.1)))
Q3 <- as.factor(sample(1:4, 500, replace = TRUE, prob = c(0.25, 0.1, 0.4, 0.25)))
Q4 <- as.factor(sample(1:4, 500, replace = TRUE, prob = c(0.1, 0.4, 0.4, 0.1)))
Q5 <- as.factor(sample(1:4, 500, replace = TRUE, prob = c(0.35, 0.25, 0.15, 0.25)))

likert_4 <- data.frame(Q1, Q2, Q3, Q4, Q5)

# create labels
levels_4 <- c("Strongly agree",
              "Agree",
              "Disagree",
              "Strongly Disagree",
              "Don't know")

# prepare data for 6-category likert scale, 5 items
likert_6 <- data.frame()

Q1 <- as.factor(sample(1:6, 500, replace = TRUE, prob = c(0.2,0.1,0.1,0.3,0.2,0.1)))
Q2 <- as.factor(sample(1:6, 500, replace = TRUE, prob = c(0.15,0.15,0.3,0.1,0.1,0.2)))
Q3 <- as.factor(sample(1:6, 500, replace = TRUE, prob = c(0.2,0.25,0.05,0.2,0.2,0.2)))
Q4 <- as.factor(sample(1:6, 500, replace = TRUE, prob = c(0.2,0.1,0.1,0.4,0.1,0.1)))
Q5 <- as.factor(sample(1:6, 500, replace = TRUE, prob = c(0.1,0.4,0.1,0.3,0.05,0.15)))

likert_6 <- data.frame(Q1, Q2, Q3, Q4, Q5)

# create labels
levels_6 <- c("Very strongly agree", "Strongly agree", "Agree",
              "Disagree", "Strongly disagree", "Very strongly disagree")

# create item labels
items <- c("Q1", "Q2", "Q3", "Q4", "Q5")

# plot dichotomous likert scale, ordered by "negative" values
sjp.likert(likert_2,
           geom.colors = c("green", "red"),
           legendLabels = levels_2,
           axisLabels.y = items,
           sort.frq = "neg.desc")
## Warning: Stacking not well defined when ymin != 0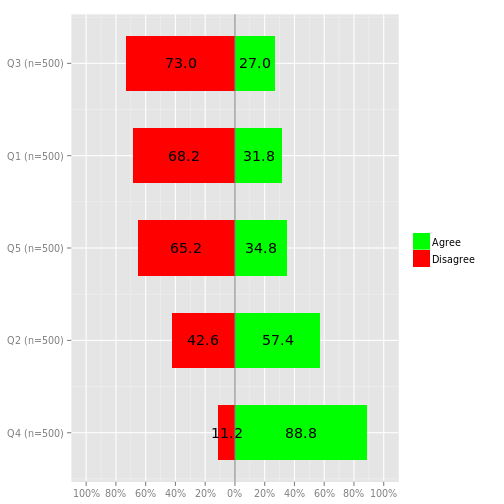
# plot 4-category-likert-scale, no order
sjp.likert(likert_4,
           cat.neutral = 5,
           legendLabels = levels_4,
           axisLabels.y = items,
           gridRange = 1.2,
           expand.grid = FALSE,
           value.labels = "sum.outside",
           showPercentageSign = TRUE)
## Warning in max(catcount): no non-missing arguments to max; returning -
## Inf## Warning in min(catcount): no non-missing arguments to min; returning
## Inf## Warning: Length of labels for item categories 'legendLabels' differs
## from detected amount of categories. Use 'catcount' argument to define
## amount of item categories, if plotting does not work.## Warning: Stacking not well defined when ymin != 0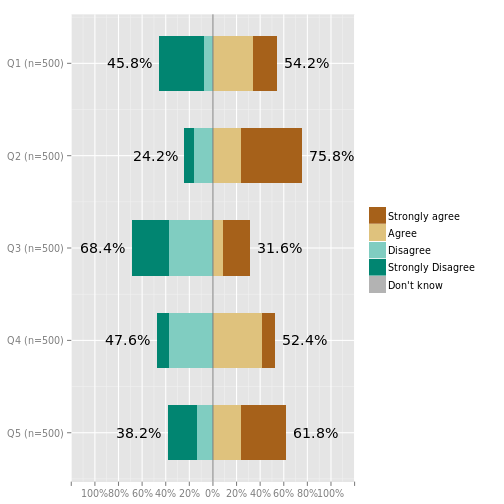
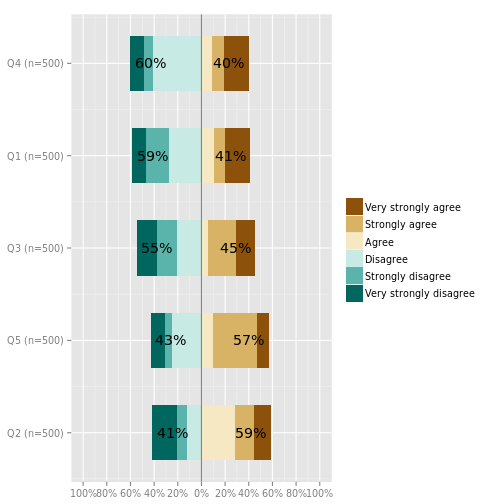
# plot 6-category-likert-scale, ordered by positive values,
# in brown color scale
sjp.likert(likert_6,
           legendLabels = levels_6,
           axisLabels.y = items,
           sort.frq = "pos.asc",
           labelDigits = 0,
           showPercentageSign = TRUE,
           value.labels = "sum.inside")
## Warning: Stacking not well defined when ymin != 0