# create 4-category-items
grp <- sample(1:4, 100, replace = TRUE)
# create 3-category-items
x <- sample(1:3, 100, replace = TRUE)

# plot "cross tablulation" of x and grp
sjp.xtab(x, grp)
## ymax not defined: adjusting position using y instead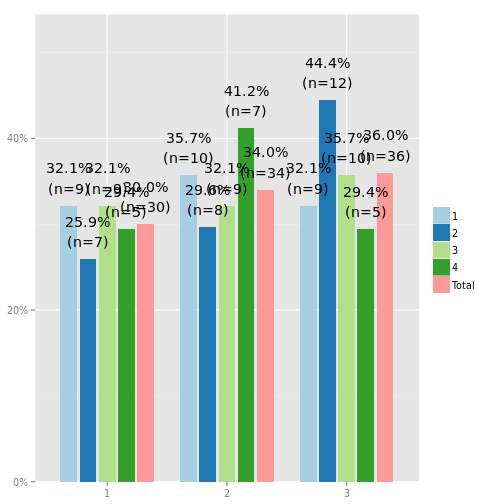
# plot "cross tablulation" of x and y, including labels
sjp.xtab(x, grp,
         axisLabels.x = c("low", "mid", "high"),
         legendLabels = c("Grp 1", "Grp 2", "Grp 3", "Grp 4"))
## ymax not defined: adjusting position using y instead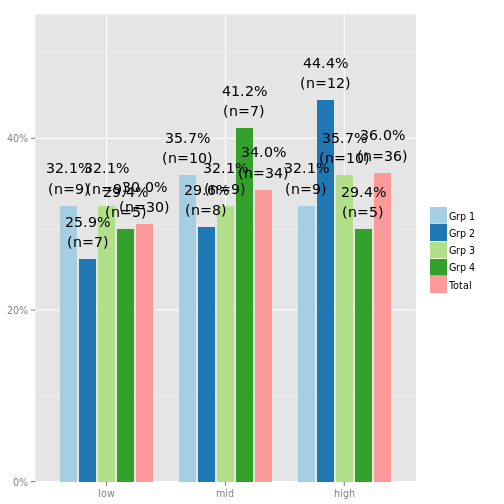
# plot "cross tablulation" of x and grp
# as stacked proportional bars
sjp.xtab(x, grp,
         tableIndex = "row",
         barPosition = "stack",
         showTableSummary = TRUE,
         coord.flip = TRUE)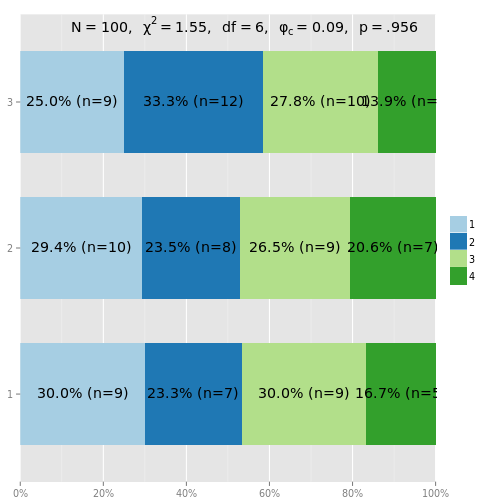
# example with vertical labels
library(sjmisc)
data(efc)
sjp.setTheme(geom.label.angle = 90)
# hjust-aes needs adjustment for this
library(ggplot2)
update_geom_defaults('text', list(hjust = -0.1))
sjp.xtab(efc$e42dep,
         efc$e16sex,
         labelPos = "center")
## ymax not defined: adjusting position using y instead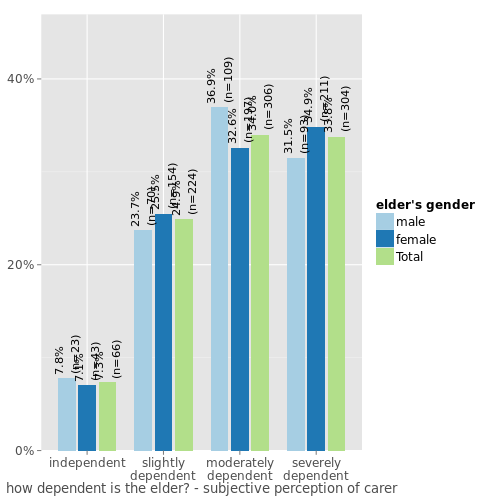
# grouped bars with EUROFAMCARE sample dataset
# dataset was importet from an SPSS-file,
# see ?sjmisc::read_spss
data(efc)
efc.val <- get_labels(efc)
efc.var <- get_label(efc)

sjp.xtab(efc$e42dep,
         efc$e16sex,
         title = efc.var['e42dep'],
         axisLabels.x = efc.val[['e42dep']],
         legendTitle = efc.var['e16sex'],
         legendLabels = efc.val[['e16sex']])
## ymax not defined: adjusting position using y instead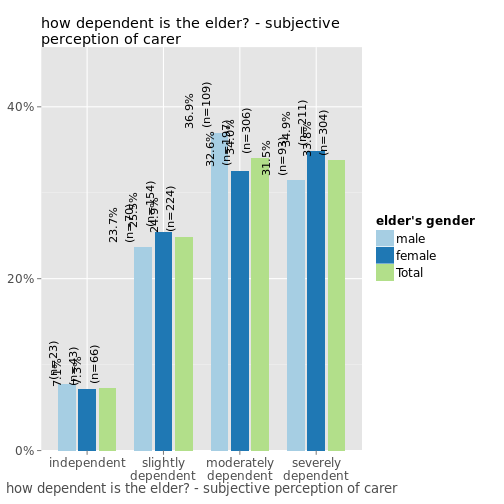
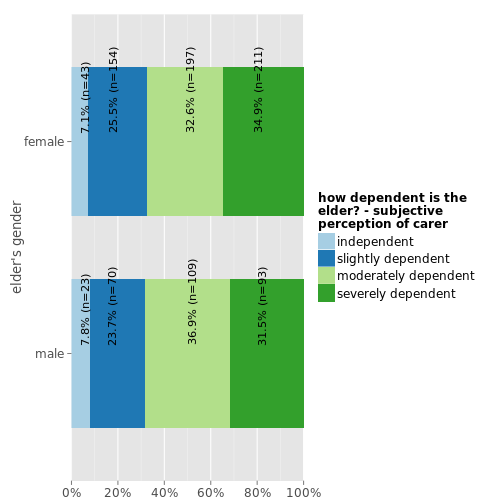
sjp.xtab(efc$e16sex,
         efc$e42dep,
         title = efc.var['e16sex'],
         axisLabels.x = efc.val[['e16sex']],
         legendTitle = efc.var['e42dep'],
         legendLabels = efc.val[['e42dep']])
## ymax not defined: adjusting position using y instead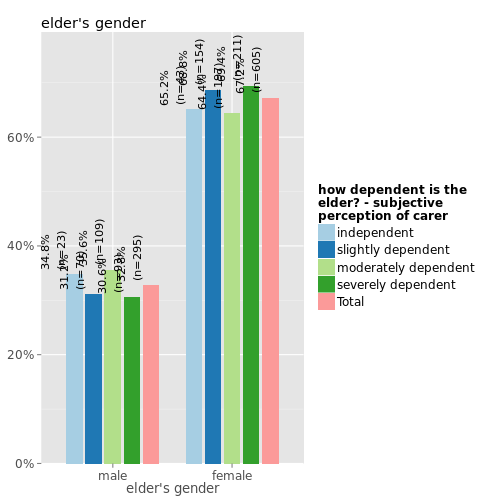
# -------------------------------
# auto-detection of labels works here
# so no need to specify labels. For
# title-auto-detection, use NULL
# -------------------------------
sjp.xtab(efc$e16sex, efc$e42dep, title = NULL)
## ymax not defined: adjusting position using y instead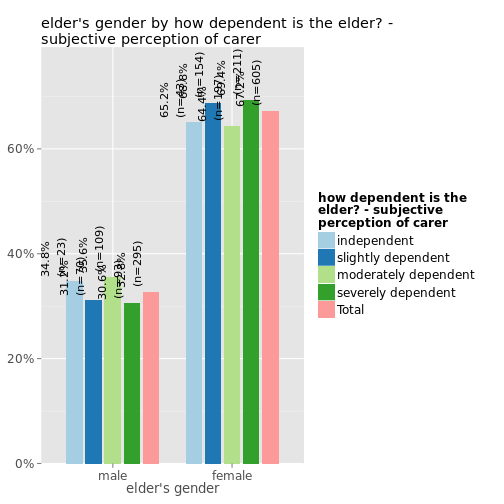
sjp.xtab(efc$e16sex,
         efc$e42dep,
         tableIndex = "row",
         barPosition = "stack",
         coord.flip = TRUE,
         jitterValueLabels = TRUE)