xrange <- range(mtcars$mpg)
yrange <- range(mtcars$wt)
p <- ggplot() +
     geom_point(aes(mpg, wt), data=mtcars) +
     xkcdaxis(xrange,yrange)
## Warning in theme_xkcd(): Not xkcd fonts installed! See vignette("xkcd-
## intro")p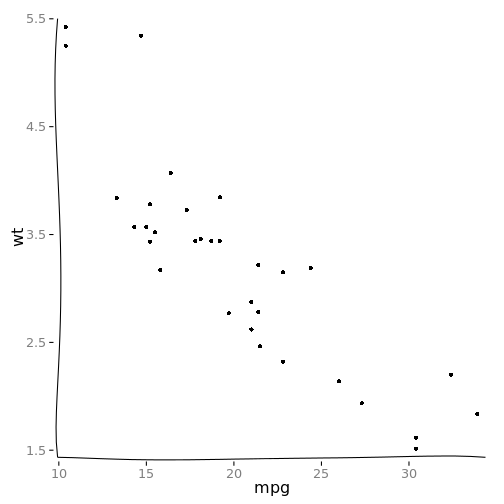
xrange <- range(mtcars$mpg)
yrange <- range(mtcars$wt)
p <- ggplot() +
geom_point(aes(mpg, wt), data=mtcars) +
xkcdaxis(xrange,yrange)## Warning in theme_xkcd(): Not xkcd fonts installed! See vignette("xkcd-
## intro")p