a <- rectGrob(gp = gpar(fill = "red"))
b <- circleGrob()
c <- linesGrob()
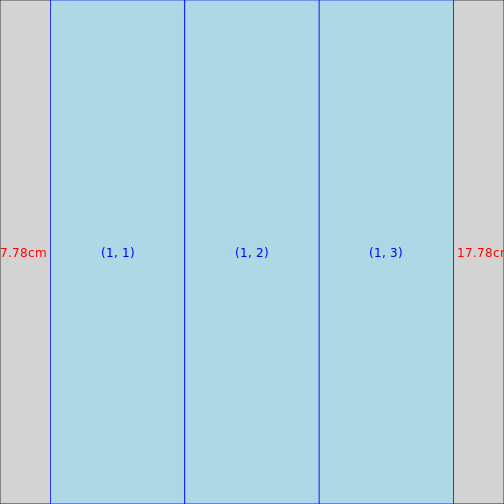
gt <- gtable_row("demo", list(a, b, c))
gt## TableGrob (1 x 3) "demo": 3 grobs
## z cells name grob
## 1 1 (1-1,1-1) demo rect[GRID.rect.1]
## 2 2 (1-1,2-2) demo circle[GRID.circle.2]
## 3 3 (1-1,3-3) demo lines[GRID.lines.3]plot(gt)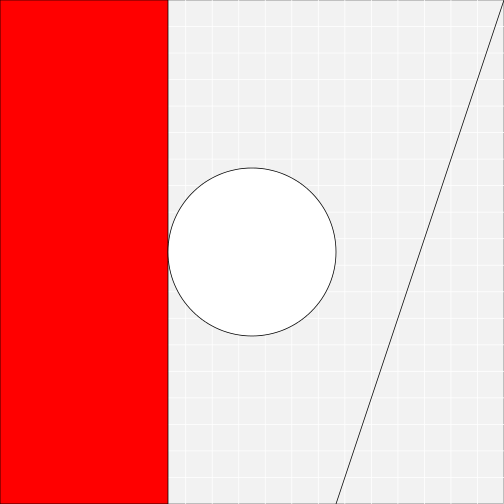
gtable_show_layout(gt)