a <- gtable(unit(1:3, c("cm")), unit(5, "cm"))
a
## TableGrob (1 x 3) "layout": 0 grobsgtable_show_layout(a)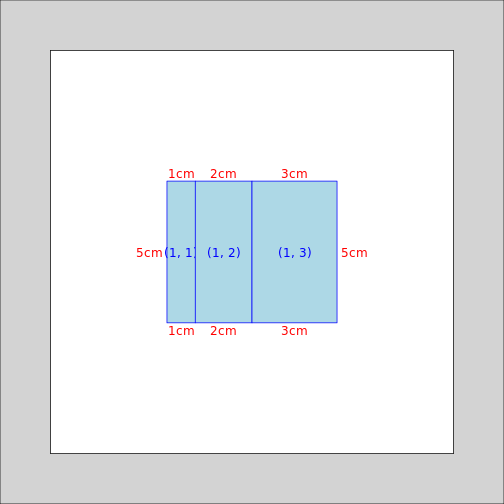
# Add a grob:
rect <- rectGrob(gp = gpar(fill = "black"))
a <- gtable_add_grob(a, rect, 1, 1)
a
## TableGrob (1 x 3) "layout": 1 grobs
## z cells name grob
## 1 1 (1-1,1-1) layout rect[GRID.rect.17]plot(a)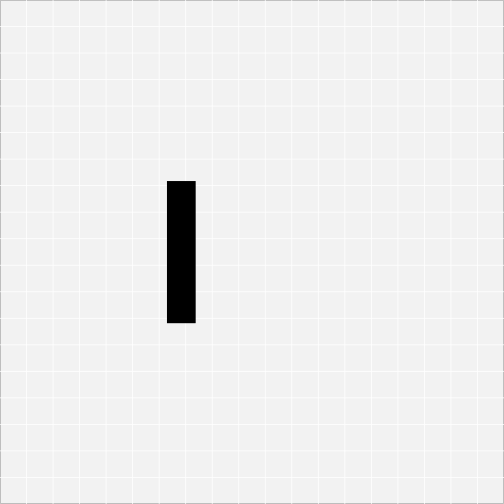
# gtables behave like matrices:
dim(a)
## [1] 1 3t(a)## TableGrob (3 x 1) "layout": 1 grobs
## z cells name grob
## 1 1 (1-1,1-1) layout rect[GRID.rect.17]plot(t(a))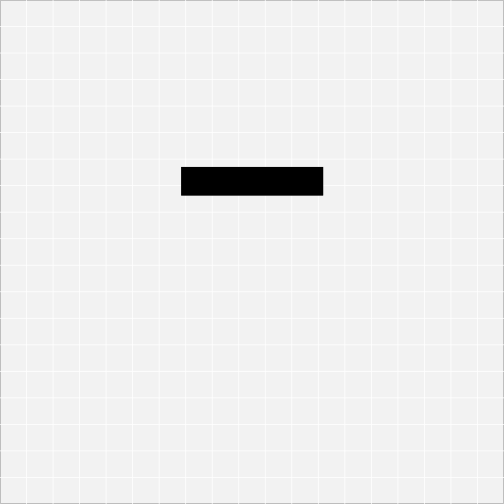
# when subsetting, grobs are retained if their extents lie in the
# rows/columns that retained.

b <- gtable(unit(c(2, 2, 2), "cm"), unit(c(2, 2, 2), "cm"))
b <- gtable_add_grob(b, rect, 2, 2)
b[1, ]
## TableGrob (1 x 3) "layout": 0 grobsb[, 1]## TableGrob (3 x 1) "layout": 0 grobsb[2, 2]## TableGrob (1 x 1) "layout": 1 grobs
## z cells name grob
## 1 1 (1-1,1-1) layout rect[GRID.rect.17]# gtable have row and column names
rownames(b) <- 1:3
rownames(b)[2] <- 200
colnames(b) <- letters[1:3]
dimnames(b)## [[1]]
## [1] 1 200 3
##
## [[2]]
## [1] "a" "b" "c"