data(linear)

# default ggpairs plot
ggs_pairs(ggs(s))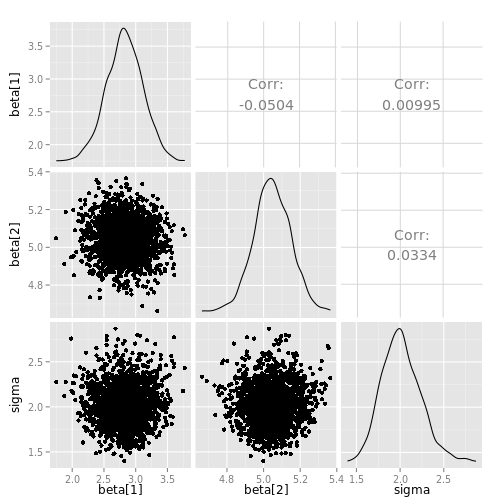
# change alpha transparency of points
ggs_pairs(ggs(s), lower=list(params=c(alpha=.2)))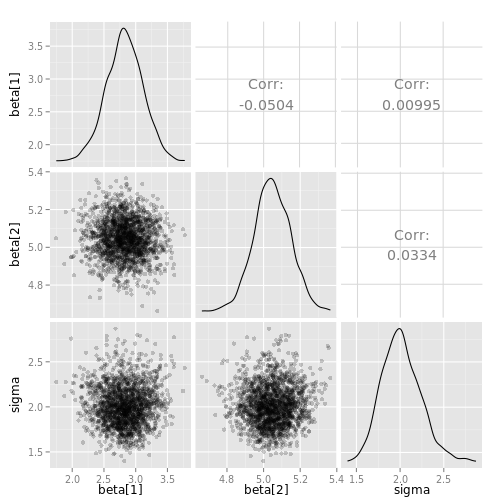
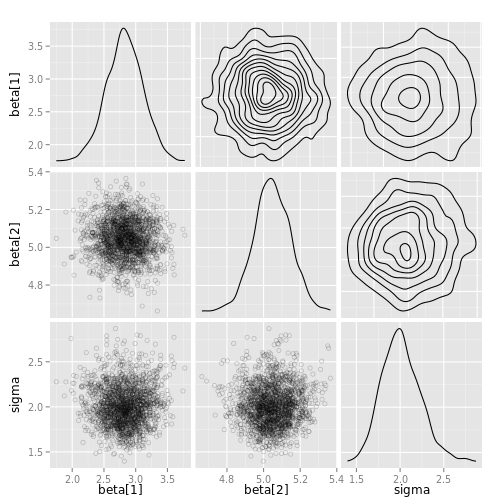
# with too many points, try contours instead
ggs_pairs(ggs(s), lower=list(continuous="density"))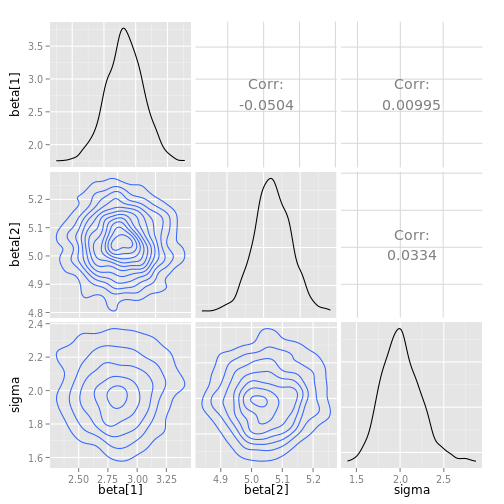
# histograms instead of univariate densities on diagonal
ggs_pairs(ggs(s), diag=list(continuous="bar"))
## stat_bin: binwidth defaulted to range/30. Use 'binwidth = x' to adjust this.
## stat_bin: binwidth defaulted to range/30. Use 'binwidth = x' to adjust this.
## stat_bin: binwidth defaulted to range/30. Use 'binwidth = x' to adjust this.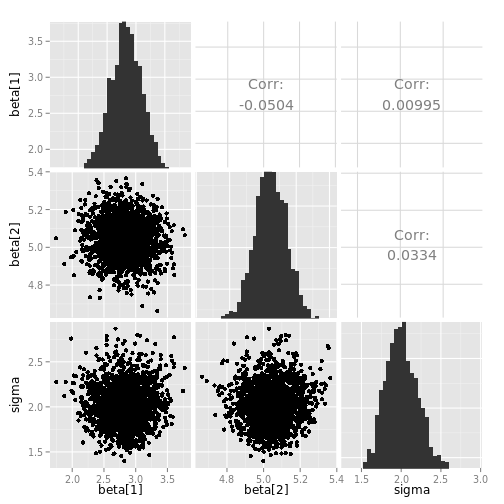
# coloring results according to chains
ggs_pairs(ggs(s), color="Chain")
## Warning in stri_c(..., sep = sep, collapse = collapse, ignore_null =
## TRUE): longer object length is not a multiple of shorter object length## Warning: The plyr::rename operation has created duplicates for the
## following name(s): (`colour`)## Warning in stri_c(..., sep = sep, collapse = collapse, ignore_null =
## TRUE): longer object length is not a multiple of shorter object length## Warning: The plyr::rename operation has created duplicates for the
## following name(s): (`colour`)## Warning in stri_c(..., sep = sep, collapse = collapse, ignore_null =
## TRUE): longer object length is not a multiple of shorter object length## Warning: The plyr::rename operation has created duplicates for the
## following name(s): (`colour`)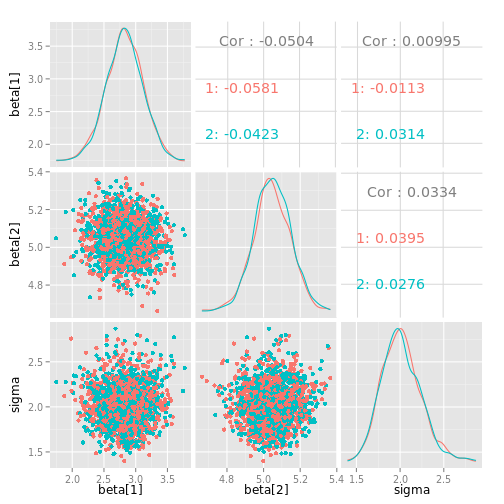
# custom points on lower panels, black contours on upper panels
ggs_pairs(ggs(s),
  upper=list(continuous="density", params=c(color="black")),
  lower=list(params=c(alpha=.2, shape=1)))