data(Feldspar)
 p <- ggtern(data=Feldspar,aes(Ab,An,Or)) + geom_point() + labs(title="Multiple Plot Example")

 #two cols
 ggtern.multi(p,p,cols=2)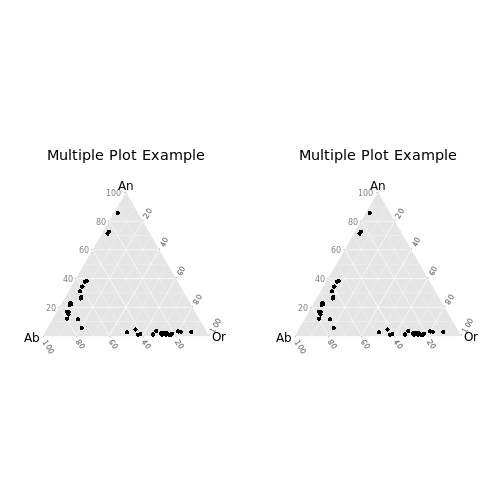
##Below are some alternatives, uncomment to run
 #ggtern.multi(plotlist=list(p,p,p))
 #ggtern.multi(p,p,p,layout=matrix(c(1,1,2,3), nrow=2,byrow=TRUE))