# load sample date
library(sjmisc)
data(efc)

# simple scatter plot, auto-jittering
sjp.scatter(efc$e16sex, efc$neg_c_7)
## auto-jittering values...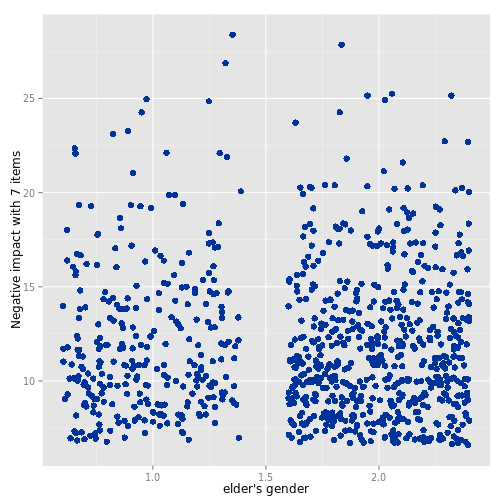
# simple scatter plot, no jittering needed
sjp.scatter(efc$c160age, efc$e17age)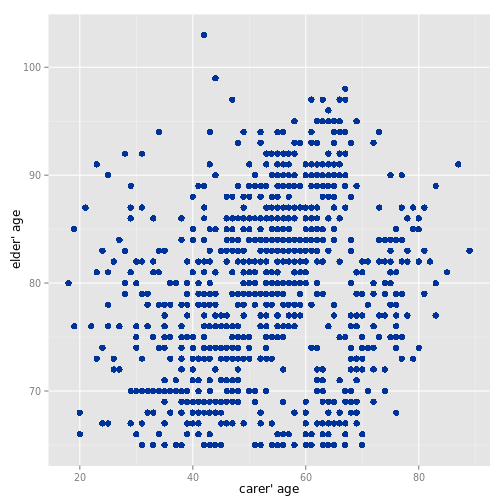
# grouped scatter plot
sjp.scatter(efc$c160age, efc$e17age, efc$e42dep)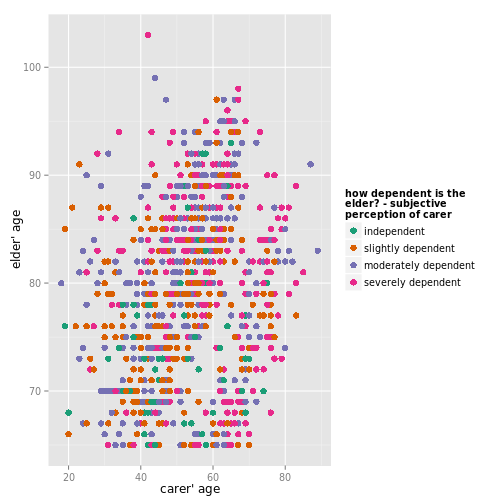
# grouped and jittered scatter plot with marginal rug plot
sjp.scatter(efc$e16sex,efc$neg_c_7, efc$c172code, showRug = TRUE)
## auto-jittering values...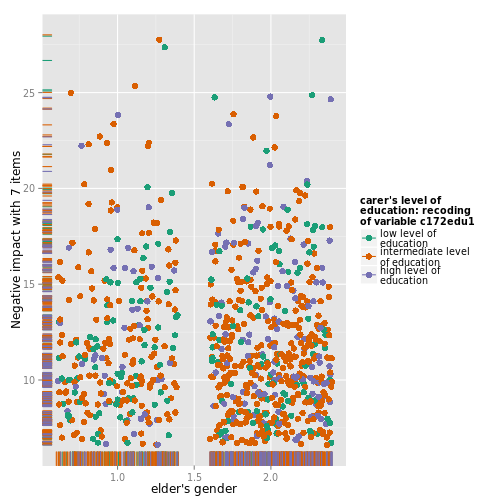
# grouped and labelled scatter plot, not using the auto-detection
# of labels, but instead pass labels as arguments
sjp.scatter(efc$c160age, efc$e17age, efc$e42dep,
            title = "Scatter Plot",
            legendTitle = get_label(efc)['e42dep'],
            legendLabels = get_labels(efc)[['e42dep']],
            axisTitle.x = get_label(efc)['c160age'],
            axisTitle.y = get_label(efc)['e17age'],
            showGroupFitLine = TRUE)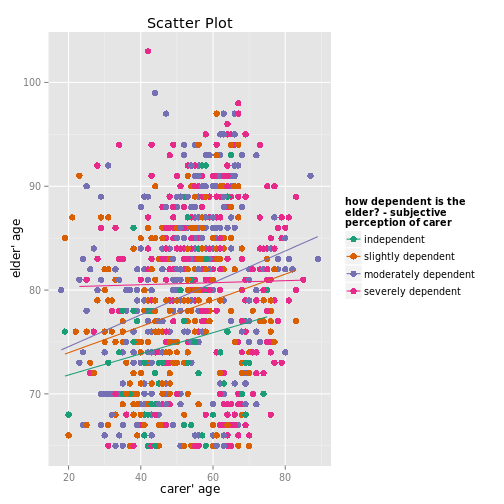
# grouped and labelled scatter plot as facets
sjp.scatter(efc$c160age,efc$e17age, efc$e42dep,
            showGroupFitLine = TRUE,
            facet.grid = TRUE,
            show.se = TRUE)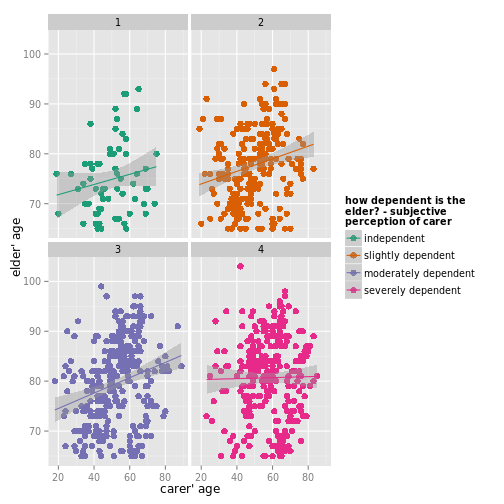
# plot residuals of fitted models
fit <- lm(neg_c_7 ~ quol_5, data = efc)
sjp.scatter(y = fit$residuals, showTotalFitLine = TRUE)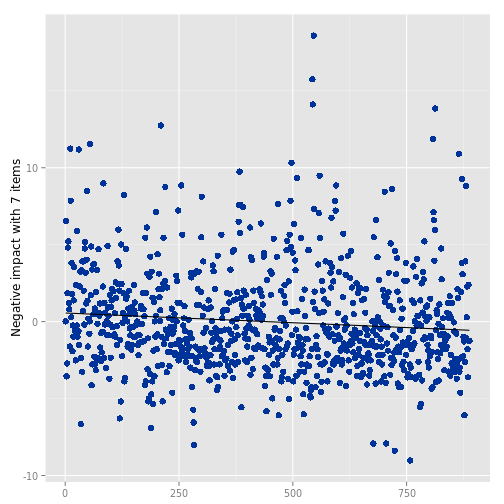
# "hide" axis titles
sjp.scatter(efc$c160age, efc$e17age, efc$e42dep,
            title = "", axisTitle.x = "", axisTitle.y = "")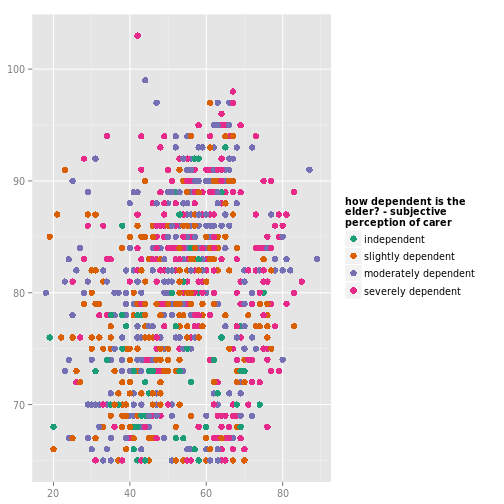
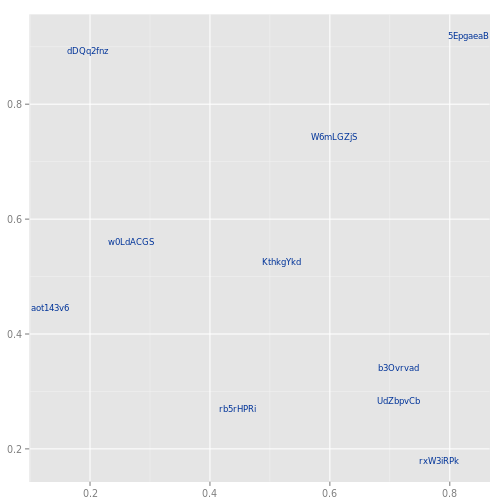
# plot text labels
pl <- c(1:10)
for (i in 1:10) pl[i] <- paste(sample(c(0:9, letters, LETTERS),
                                      8, replace = TRUE),
                               collapse = "")
sjp.scatter(runif(10), runif(10), pointLabels = pl)