# histrogram with EUROFAMCARE sample dataset
library(sjmisc)
data(efc)
efc.val <- get_labels(efc)
efc.var <- get_label(efc)
sjp.grpfrq(efc$e17age,
           efc$e16sex,
           title = efc.var['e17age'],
           type = "hist",
           showValueLabels = FALSE,
           showMeanIntercept = TRUE)
## Warning: Removed 128 rows containing missing values (geom_text).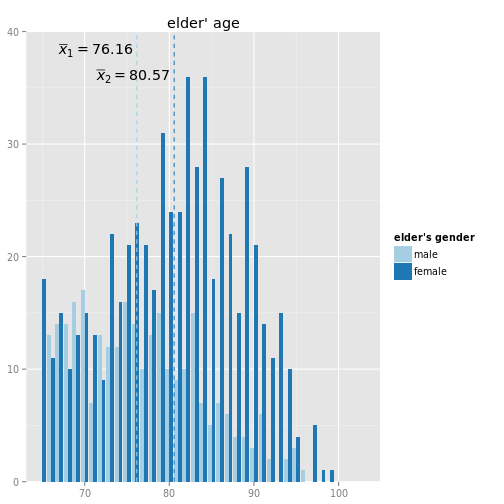
# boxplot
sjp.grpfrq(efc$e17age,
           efc$e42dep,
           type = "box")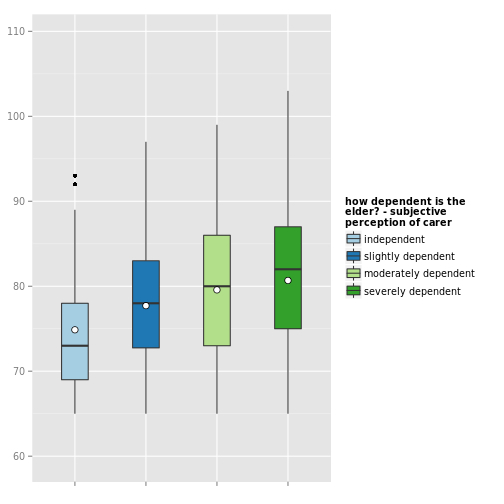
# -------------------------------------------------
# auto-detection of value labels and variable names
# -------------------------------------------------
# grouped bars using necessary y-limit
sjp.grpfrq(efc$e42dep,
           efc$e16sex,
           title = NULL)
## ymax not defined: adjusting position using y instead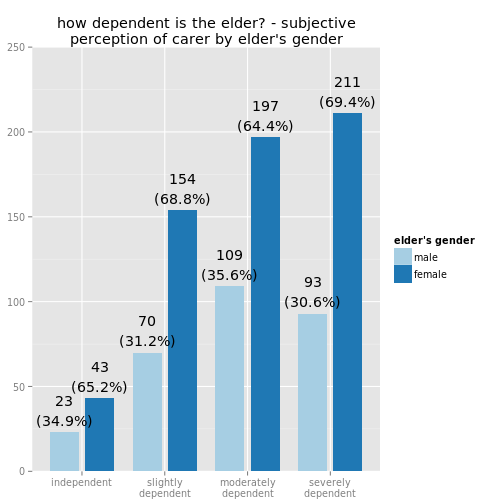
# box plots with interaction variable
sjp.grpfrq(efc$e17age,
           efc$e42dep,
           interactionVar = efc$e16sex,
           title = paste(efc.var['e17age'],
                         "by",
                         efc.var['e42dep'],
                         "and",
                         efc.var['e16sex']),
           axisLabels.x = efc.val[['e17age']],
           interactionVarLabels = efc.val[['e16sex']],
           legendTitle = efc.var['e42dep'],
           legendLabels = efc.val[['e42dep']],
           type = "box")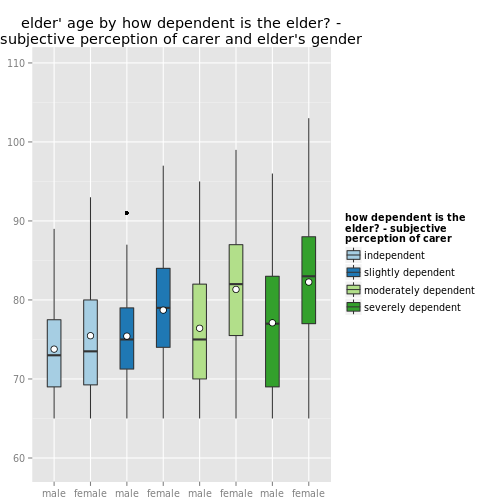
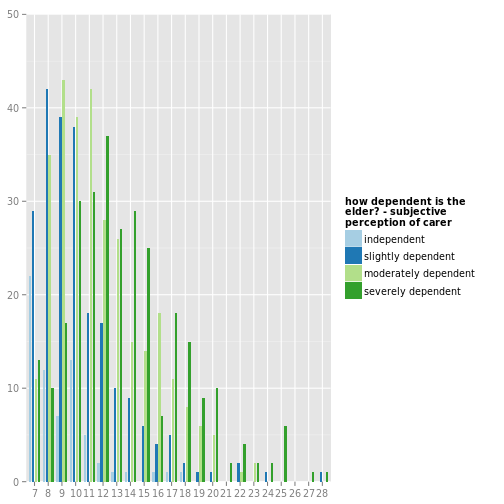
# Grouped bar plot ranging from 1 to 28 (though scale starts with 7)
sjp.grpfrq(efc$neg_c_7,
           efc$e42dep,
           showValueLabels = FALSE,
           startAxisAt = 1)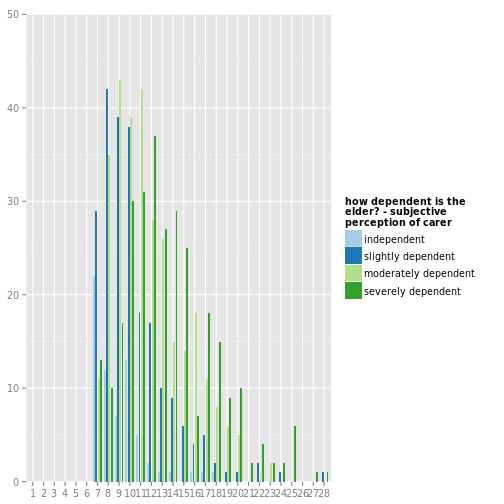
# Same grouped bar plot ranging from 7 to 28
sjp.grpfrq(efc$neg_c_7,
           efc$e42dep,
           showValueLabels = FALSE)
## Warning: Removed 24 rows containing missing values (geom_text).