# prepare dichotomous dependent variable
y <- ifelse(swiss$Fertility < median(swiss$Fertility), 0, 1)

# fit model
fitOR <- glm(y ~ swiss$Education + swiss$Examination + swiss$Infant.Mortality + swiss$Catholic,
             family = binomial(link = "logit"))

# print Odds Ratios as dots
sjp.glm(fitOR)
## Waiting for profiling to be done...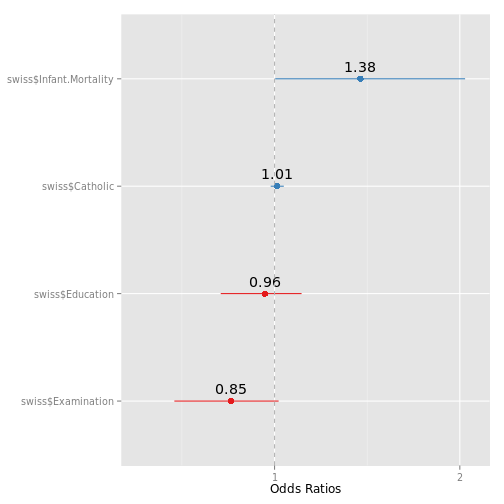
# print Odds Ratios as bars
sjp.glm(fitOR, type = "bars", geom.size = .3)
## Waiting for profiling to be done...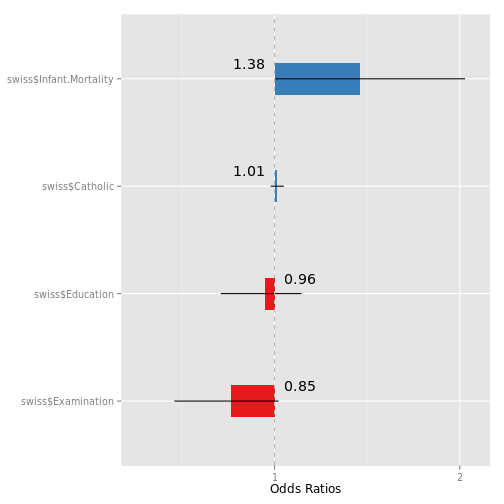
# -------------------------------
# Predictors for negative impact
# of care. Data from the EUROFAMCARE
# sample dataset
# -------------------------------
library(sjmisc)
data(efc)
# retrieve predictor variable labels
labs <- get_label(efc)
predlab <- c(labs[['c161sex']],
             paste0(labs[['e42dep']], " (slightly)"),
             paste0(labs[['e42dep']], " (moderate)"),
             paste0(labs[['e42dep']], " (severely)"),
             labs[['barthtot']],
             paste0(labs[['c172code']], " (mid)"),
             paste0(labs[['c172code']], " (high)"))
# create binary response
y <- ifelse(efc$neg_c_7 < median(na.omit(efc$neg_c_7)), 0, 1)
# create dummy variables for educational status
edu.mid <- ifelse(efc$c172code == 2, 1, 0)
edu.high <- ifelse(efc$c172code == 3, 1, 0)
# create data frame for fitted model
mydf <- data.frame(y = as.factor(y),
                   sex = as.factor(efc$c161sex),
                   dep = as.factor(efc$e42dep),
                   barthel = as.numeric(efc$barthtot),
                   edu.mid = as.factor(edu.mid),
                   edu.hi = as.factor(edu.high))
# fit model
fit <- glm(y ~., data = mydf, family = binomial(link = "logit"))
# plot odds
sjp.glm(fit,
        title = labs[['neg_c_7']],
        axisLabels.y = predlab)
## Waiting for profiling to be done...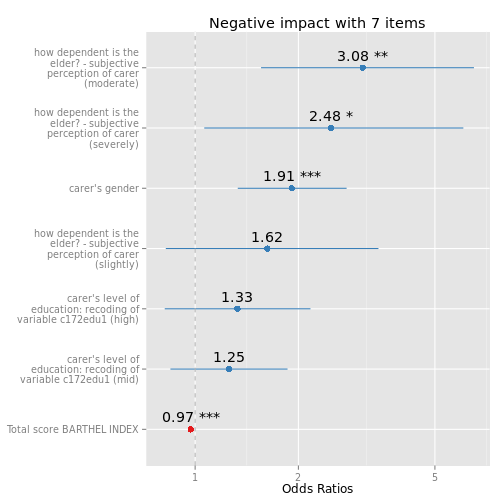
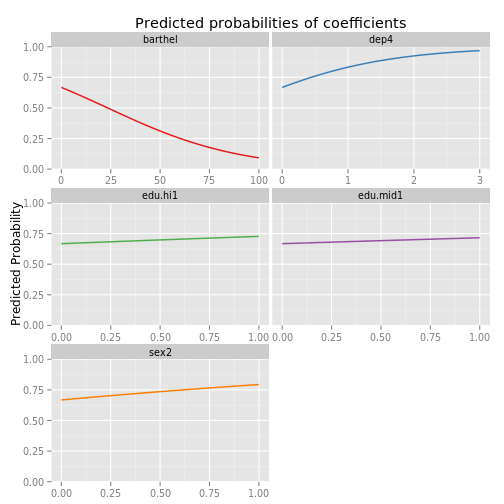
# plot probability curves (predicted probabilities)
# of coefficients
sjp.glm(fit,
        title = labs[['neg_c_7']],
        axisLabels.y = predlab,
        type = "prob")
## Warning: non-integer #successes in a binomial glm!## Warning: non-integer #successes in a binomial glm!## Warning: non-integer #successes in a binomial glm!## Warning: non-integer #successes in a binomial glm!## Warning: non-integer #successes in a binomial glm!