# a simple t-distribution
# for 6 degrees of freedom
dist_t(deg.f = 6)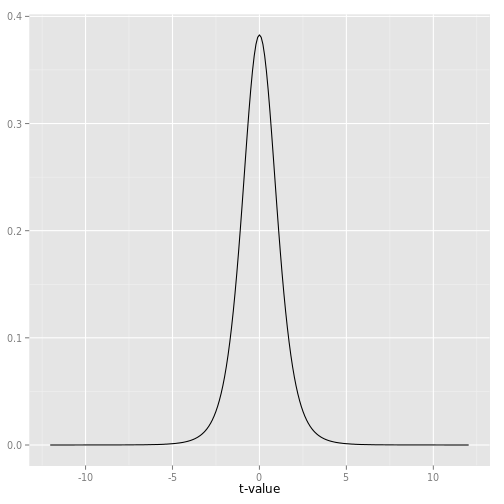
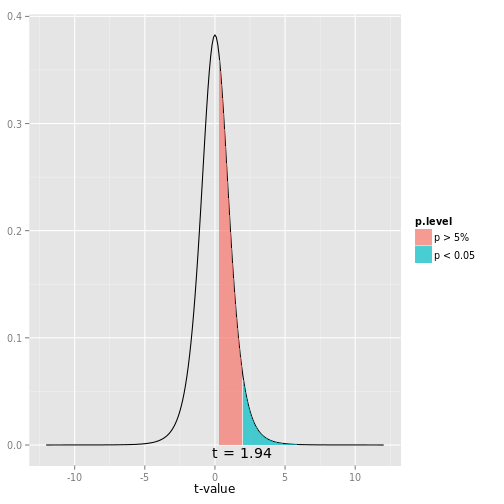
# a t-distribution for 6 degrees of freedom,
# and a shaded area starting at t-value of one.
# With a df of 6, a t-value of 1.94 would be "significant".
dist_t(t = 1, deg.f = 6)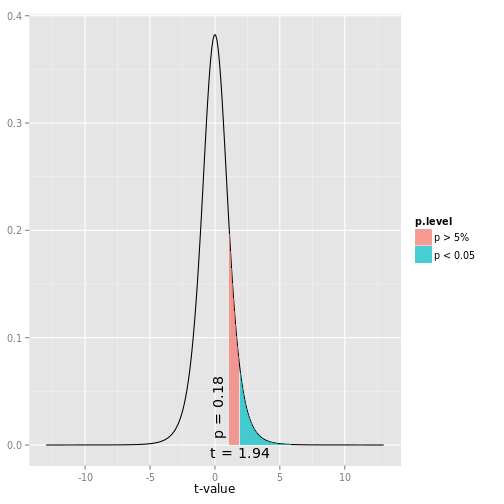
# a t-distribution for 6 degrees of freedom,
# and a shaded area starting at p-level of 0.4
# (t-value of about 0.26).
dist_t(p = 0.4, deg.f = 6)