# a simple chi-squared distribution
# for 6 degrees of freedom
dist_chisq(deg.f = 6)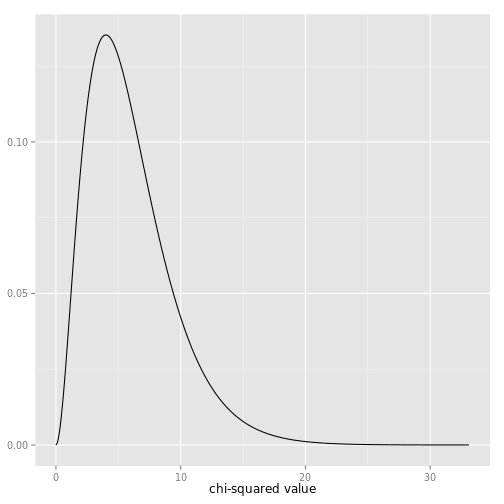
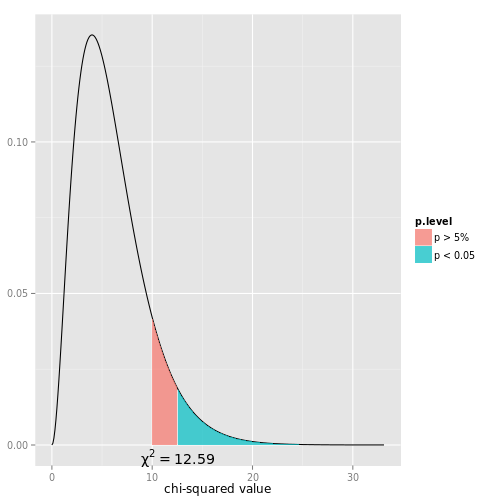
# a chi-squared distribution for 6 degrees of freedom,
# and a shaded area starting at chi-squared value of ten.
# With a df of 6, a chi-squared value of 12.59 would be "significant",
# thus the shaded area from 10 to 12.58 is filled as "non-significant",
# while the area starting from chi-squared value 12.59 is filled as
# "significant"
dist_chisq(chi2 = 10, deg.f = 6)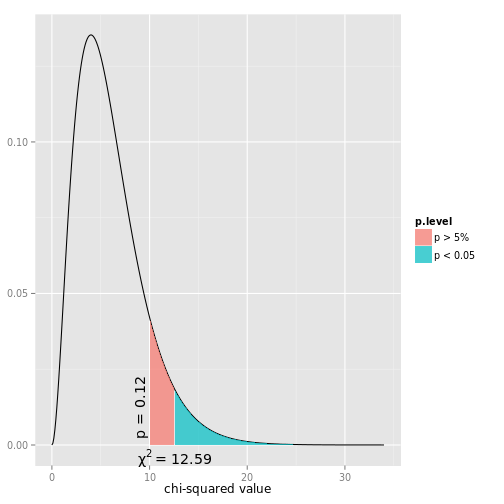
# a chi-squared distribution for 6 degrees of freedom,
# and a shaded area starting at that chi-squared value, which has
# a p-level of about 0.125 (which equals a chi-squared value of about 10).
# With a df of 6, a chi-squared value of 12.59 would be "significant",
# thus the shaded area from 10 to 12.58 (p-level 0.125 to p-level 0.05)
# is filled as "non-significant", while the area starting from chi-squared
# value 12.59 (p-level < 0.05) is filled as "significant".
dist_chisq(p = 0.125, deg.f = 6)