# sample data set
library(sjmisc)
data(efc)
# show frequencies of relationship-variable and
# retrieve plot object
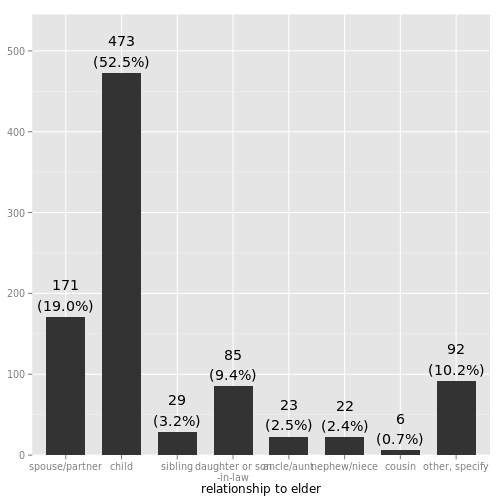
gp <- sjp.frq(efc$e15relat, printPlot = FALSE)
# show current plot
plot(gp$plot)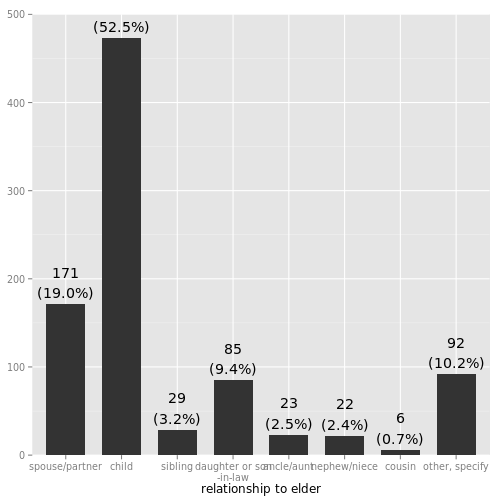
# show adjusted plot
adjust_plot_range(gp$plot)
## Scale for 'y' is already present. Adding another scale for 'y', which will replace the existing scale.
## Scale for 'y' is already present. Adding another scale for 'y', which will replace the existing scale.