gt <- gtable(unit(rep(5, 3), c("cm")), unit(5, "cm"))
rect <- rectGrob(gp = gpar(fill = "black"))
circ <- circleGrob(gp = gpar(fill = "red"))

gt <- gtable_add_grob(gt, rect, 1, 1, name = "rect")
gt <- gtable_add_grob(gt, circ, 1, 3, name = "circ")

plot(gtable_filter(gt, "rect"))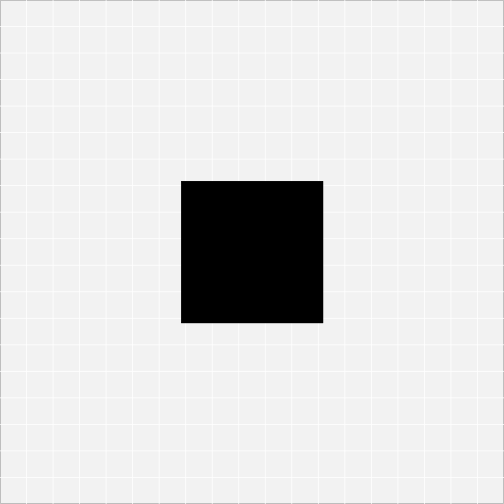
plot(gtable_filter(gt, "rect", trim = FALSE))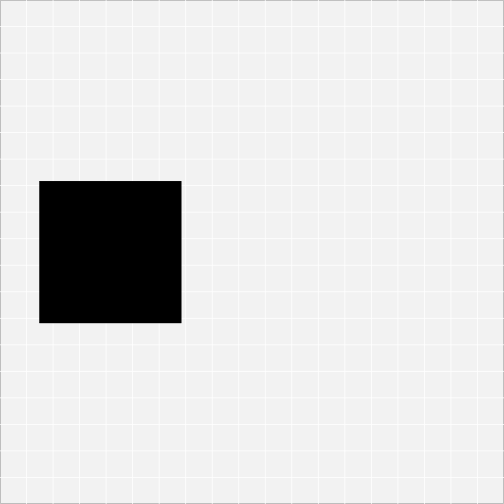
plot(gtable_filter(gt, "circ"))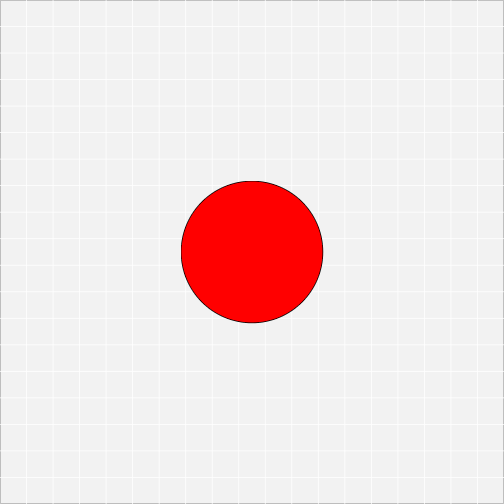
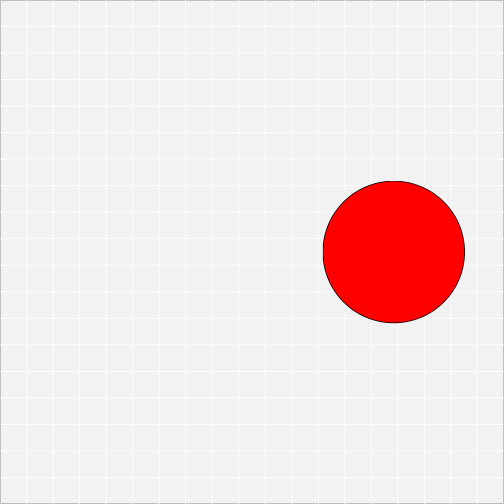
plot(gtable_filter(gt, "circ", trim = FALSE))