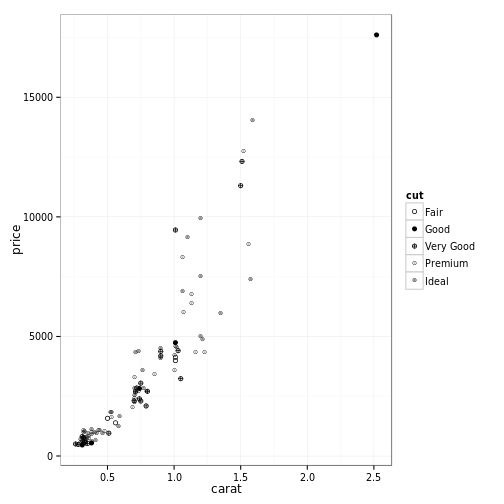
# overlapping symbol palette
dsamp <- diamonds[sample(nrow(diamonds), 100), ]
(qplot(carat, price, data=dsamp, shape=cut)
+ theme_bw() + scale_shape_cleveland())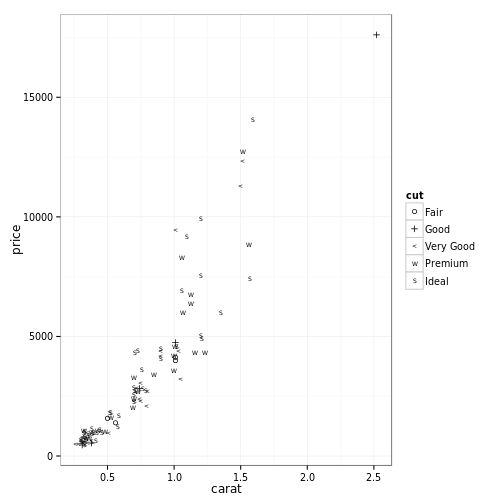
# non-overlapping symbol palette
(qplot(carat, price, data=dsamp, shape=cut)
+ theme_bw() + scale_shape_cleveland(overlap=FALSE))