##-----------------------------------------------
## Basic Usage
##-----------------------------------------------
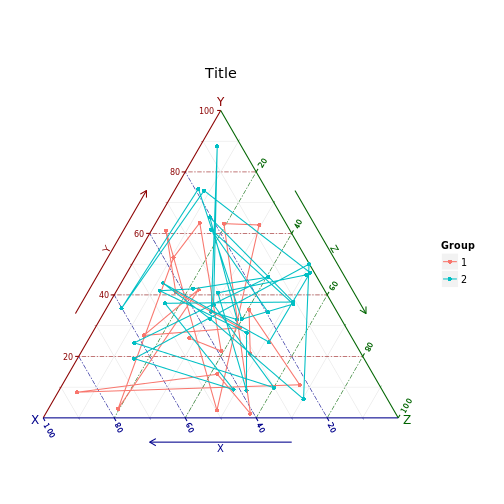
df = data.frame(x = runif(50),
y = runif(50),
z = runif(50),
Value = runif(50,1,10),
Group = as.factor(round(runif(50,1,2))))
ggtern(data=df,aes(x,y,z,color=Group)) +
theme_rgbw() +
geom_point() + geom_path() +
labs(x="X",y="Y",z="Z",title="Title")