data(Feldspar)
plot <- ggtern(data=Feldspar,aes(Ab,An,Or)) +  geom_point() +
        xlab("ABC") + ylab("DEF") + zlab("GHI")

#Alternatives, and Arrow Label
plot + Tlab("TOP") + Llab("LHS") + Rlab("RHS") +
  theme_showarrows() + Wlab("WEIGHT")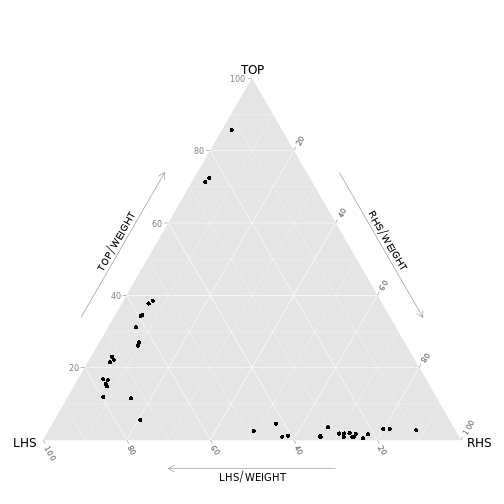
data(Feldspar)
plot <- ggtern(data=Feldspar,aes(Ab,An,Or)) + geom_point() +
xlab("ABC") + ylab("DEF") + zlab("GHI")
#Alternatives, and Arrow Label
plot + Tlab("TOP") + Llab("LHS") + Rlab("RHS") +
theme_showarrows() + Wlab("WEIGHT")