# Load a set of plot.variable partial plot data
data(partial_pbc)

# A list of 2 plot.variable objects
length(partial_pbc)
## [1] 3class(partial_pbc)## [1] "list"class(partial_pbc[[1]])## [1] "rfsrc" "plot.variable" "surv"class(partial_pbc[[2]])## [1] "rfsrc" "plot.variable" "surv"# Create gg_partial objects
ggPrtl.1 <- gg_partial(partial_pbc[[1]])
ggPrtl.2 <- gg_partial(partial_pbc[[2]])
# Combine the objects to get multiple time curves
# along variables on a single figure.
ggpart <- combine.gg_partial(ggPrtl.1, ggPrtl.2,
lbls = c("1 year", "3 years"))
# Plot each figure separately
plot(ggpart)## [[1]]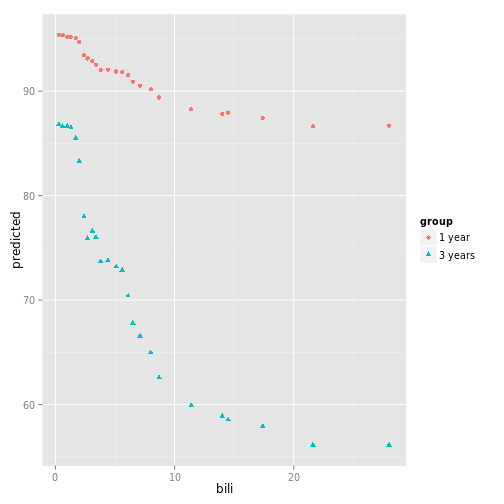
##
## [[2]]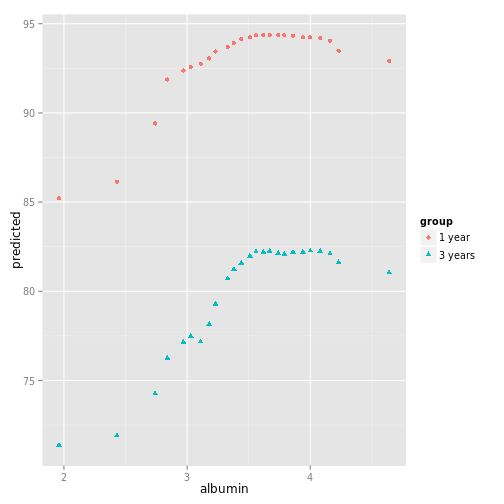
##
## [[3]]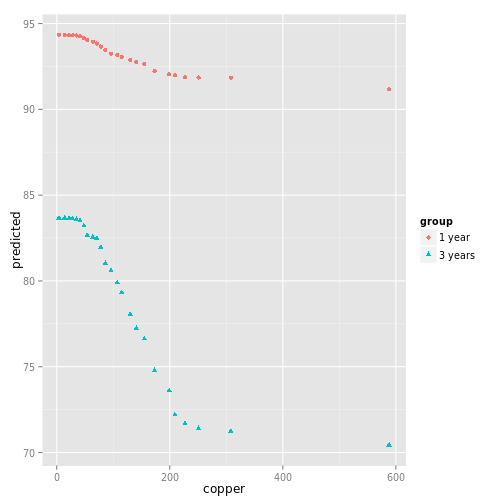
##
## [[4]]
##
## [[5]]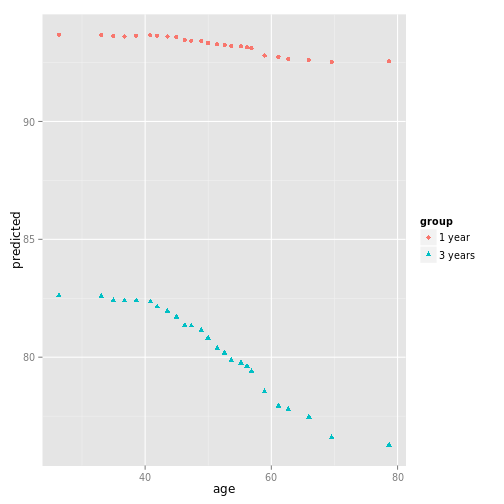
##
## [[6]]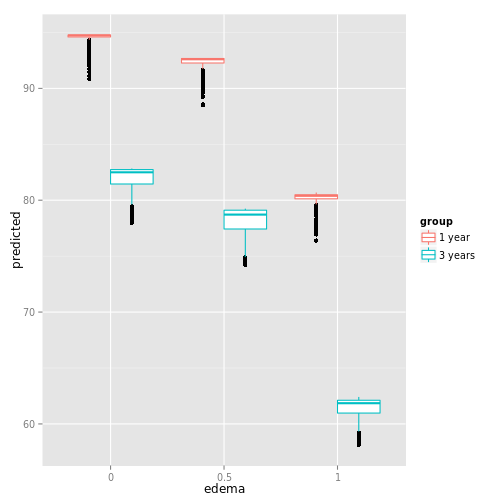
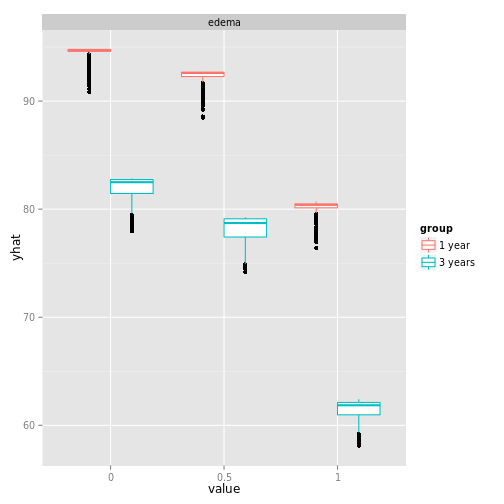
# Get the continuous data for a panel of continuous plots.
ggcont <- ggpart
ggcont$edema <- ggcont$ascites <- ggcont$stage <- NULL
plot(ggcont, panel=TRUE)
## geom_smooth: method="auto" and size of largest group is <1000, so using loess. Use 'method = x' to change the smoothing method.
## geom_smooth: method="auto" and size of largest group is <1000, so using loess. Use 'method = x' to change the smoothing method.
## geom_smooth: method="auto" and size of largest group is <1000, so using loess. Use 'method = x' to change the smoothing method.
## geom_smooth: method="auto" and size of largest group is <1000, so using loess. Use 'method = x' to change the smoothing method.
## geom_smooth: method="auto" and size of largest group is <1000, so using loess. Use 'method = x' to change the smoothing method.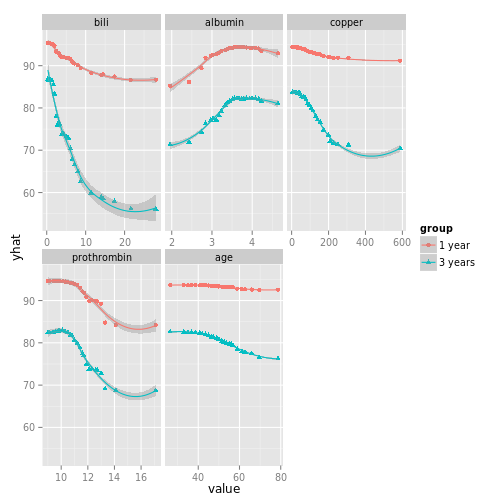
# And the categorical for a panel of categorical plots.
nms <- colnames(sapply(ggcont, function(st){st}))
for(ind in nms){
   ggpart[[ind]] <- NULL
}
plot(ggpart, panel=TRUE)