if (require(survival) && require(scales)) {
data(lung, package = "survival")
sf.lung <- survival::survfit(Surv(time, status) ~ 1, data = lung)
ggsurv(sf.lung)
# Multiple strata examples
sf.sex <- survival::survfit(Surv(time, status) ~ sex, data = lung)
pl.sex <- ggsurv(sf.sex)
pl.sex
# Adjusting the legend of the ggsurv fit
pl.sex +
ggplot2::guides(linetype = FALSE) +
ggplot2::scale_colour_discrete(
name = 'Sex',
breaks = c(1,2),
labels = c('Male', 'Female')
)
# We can still adjust the plot after fitting
data(kidney, package = "survival")
sf.kid <- survival::survfit(Surv(time, status) ~ disease, data = kidney)
pl.kid <- ggsurv(sf.kid, plot.cens = FALSE)
pl.kid
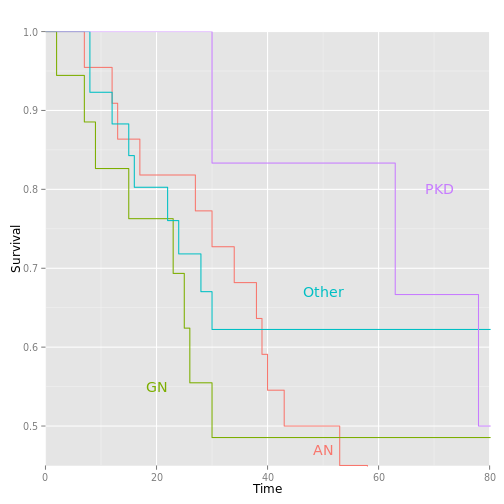
# Zoom in to first 80 days
pl.kid <- pl.kid + ggplot2::coord_cartesian(xlim = c(0, 80), ylim = c(0.45, 1))
pl.kid
# Add the diseases names to the plot and remove legend
col <- scales::hue_pal(
h = c(0, 360) + 15,
c = 100,
l = 65,
h.start = 0,
direction = 1
)(4)
pl.kid +
ggplot2::annotate(
"text",
label = c('AN', 'GN', 'Other', 'PKD'),
x = c(50, 20, 50, 71),
y = c(0.47, 0.55, 0.67, 0.8),
size = 5,
colour = col
) +
ggplot2::guides(color = FALSE, linetype = FALSE)
}## Loading required package: survival
## Loading required package: scales
## Scale for 'colour' is already present. Adding another scale for 'colour', which will replace the existing scale.