data(tips, package = "reshape")
 ggally_dot(tips, mapping = ggplot2::aes(x = total_bill, y = sex))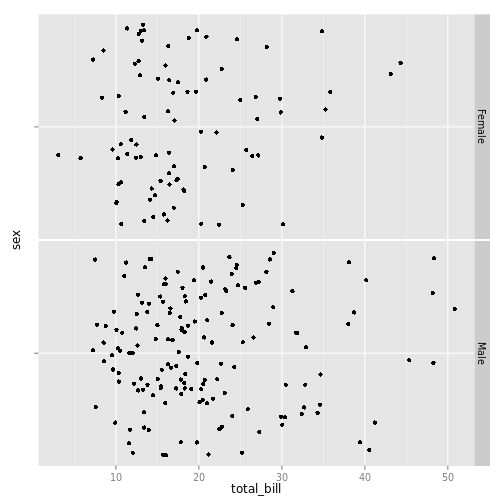
ggally_dot(tips, mapping = ggplot2::aes_string(x = "total_bill", y = "sex"))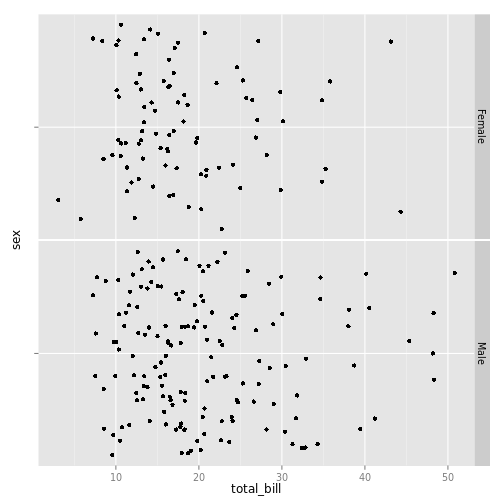
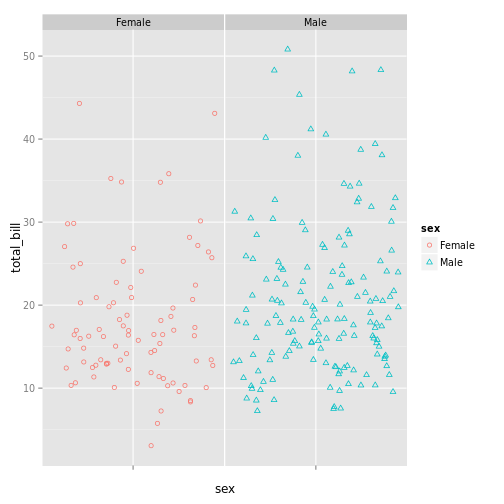
ggally_dot(
   tips,
   mapping = ggplot2::aes_string(y = "total_bill", x = "sex", color = "sex")
 )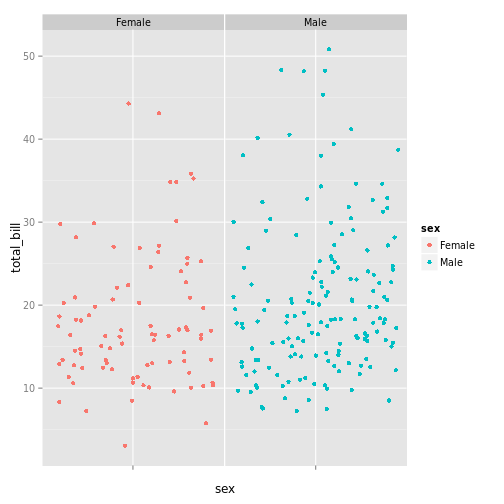
ggally_dot(
   tips,
   mapping = ggplot2::aes_string(y = "total_bill", x = "sex", color = "sex", shape = "sex")
 ) + ggplot2::scale_shape(solid=FALSE)