data(tips, package = "reshape")
 ggally_box(tips, mapping = ggplot2::aes(x = total_bill, y = sex))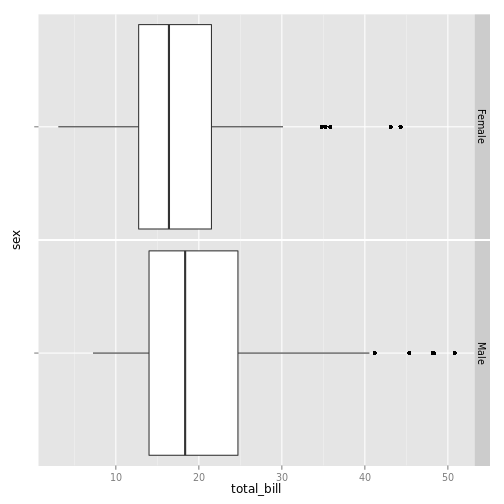
ggally_box(tips, mapping = ggplot2::aes_string(x = "total_bill", y = "sex"))
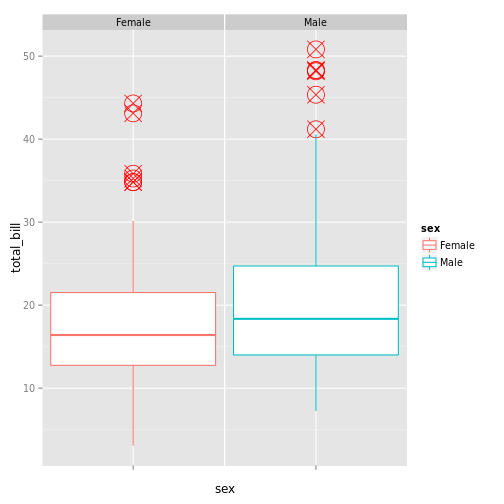
ggally_box(
   tips,
   mapping        = ggplot2::aes_string(y = "total_bill", x = "sex", color = "sex"),
   outlier.colour = "red",
   outlier.shape  = 13,
   outlier.size   = 8
 )