data(tips, package = "reshape")
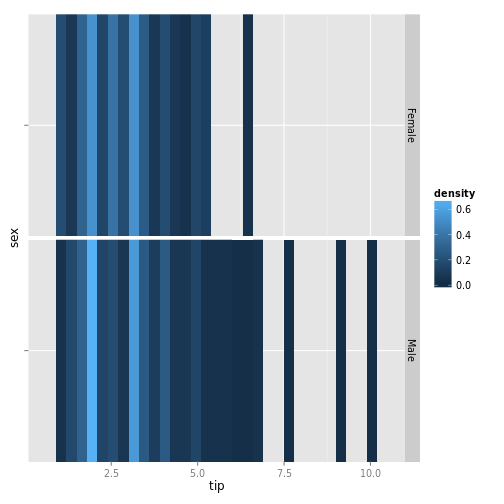
plotMatrix2 <- ggpairs(tips[,3:2], upper = list(combo = "denstrip"))
getPlot(plotMatrix2, 1, 2)## stat_bin: binwidth defaulted to range/30. Use 'binwidth = x' to adjust this.
## stat_bin: binwidth defaulted to range/30. Use 'binwidth = x' to adjust this.