set.seed(1234)
#generate sample data
x <- rnorm(10, mean=rep(1:5, each=2), sd=0.4)
y <- rnorm(10, mean=rep(c(1,2), each=5), sd=0.4)
dataFrame <- data.frame(x=x, y=y, row.names=c(1:10))
#calculate distance matrix. default is Euclidean distance
distxy <- dist(dataFrame)
#perform hierarchical clustering. default is complete linkage.
hc <- hclust(distxy)
dend <- as.dendrogram(hc)
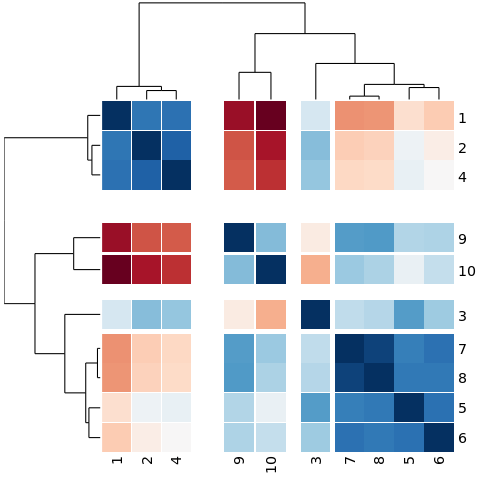
#make a cluster heatmap plot
gapmap(m = as.matrix(distxy), d_row= rev(dend), d_col=dend)